


 (73).png)
Atlanta's World Cup created a meaningful six-week pricing opportunity for short-term rental owners. It also attracted 4,329 additional listings between June 2025 and June 2026, a 28.8% increase in supply. Booked nights increased 4.2% over the same period and declined 2.3% year over year in July, so the additional demand was not large enough to absorb the inventory that entered the market.
The distinction between price and demand matters. June ADR increased 27.1% year over year and lifted RevPAR 15.7%, even as occupancy fell 5.6 percentage points. In July, ADR remained 19.4% above last year, but occupancy fell another 7.8 points and the RevPAR gain narrowed to 4.7%. The tournament allowed owners to charge more for the nights they sold; it did not produce a comparable increase in the number of nights guests booked.
Our portfolio also benefited from the event, but the result varied materially by configuration. On the displayed series, we retained more of the June lift than the Atlanta market did and remained ahead of the market in every configuration we report. The underlying availability definitions have not been reconciled from raw data, so the market-relative levels are directional rather than publication-ready. The same data also shows where demand softened, which is why we are moving to low-season pricing earlier and putting more emphasis on longer stays.
Contents
The Market's World Cup
Atlanta hosted eight matches: five group-stage fixtures on June 15, 18, 21, 24, and 27, followed by the Round of 32 on July 1, the Round of 16 on July 7, and a semifinal on July 15. June was the group stage and July was the knockout stage. Neither month represents a clean post-event period; August will be the first month that does, and we will cover it in the next update.
The market produced different results in June and July:
| Atlanta market, all bedrooms | June 2026 | vs Jun 2025 | July 2026 | vs Jul 2025 |
|---|---|---|---|---|
| Total listings | 19,365 | +28.8% | 19,335 | +27.1% |
| Available nights | 347,346 | +14.5% | 376,220 | +11.4% |
| Booked nights | 198,146 | +4.2% | 209,931 | −2.3% |
| Occupancy | 57.0% | −5.6pt | 55.8% | −7.8pt |
| ADR | $229.62 | +27.1% | $218.54 | +19.4% |
| RevPAR | $130.99 | +15.7% | $121.94 | +4.7% |
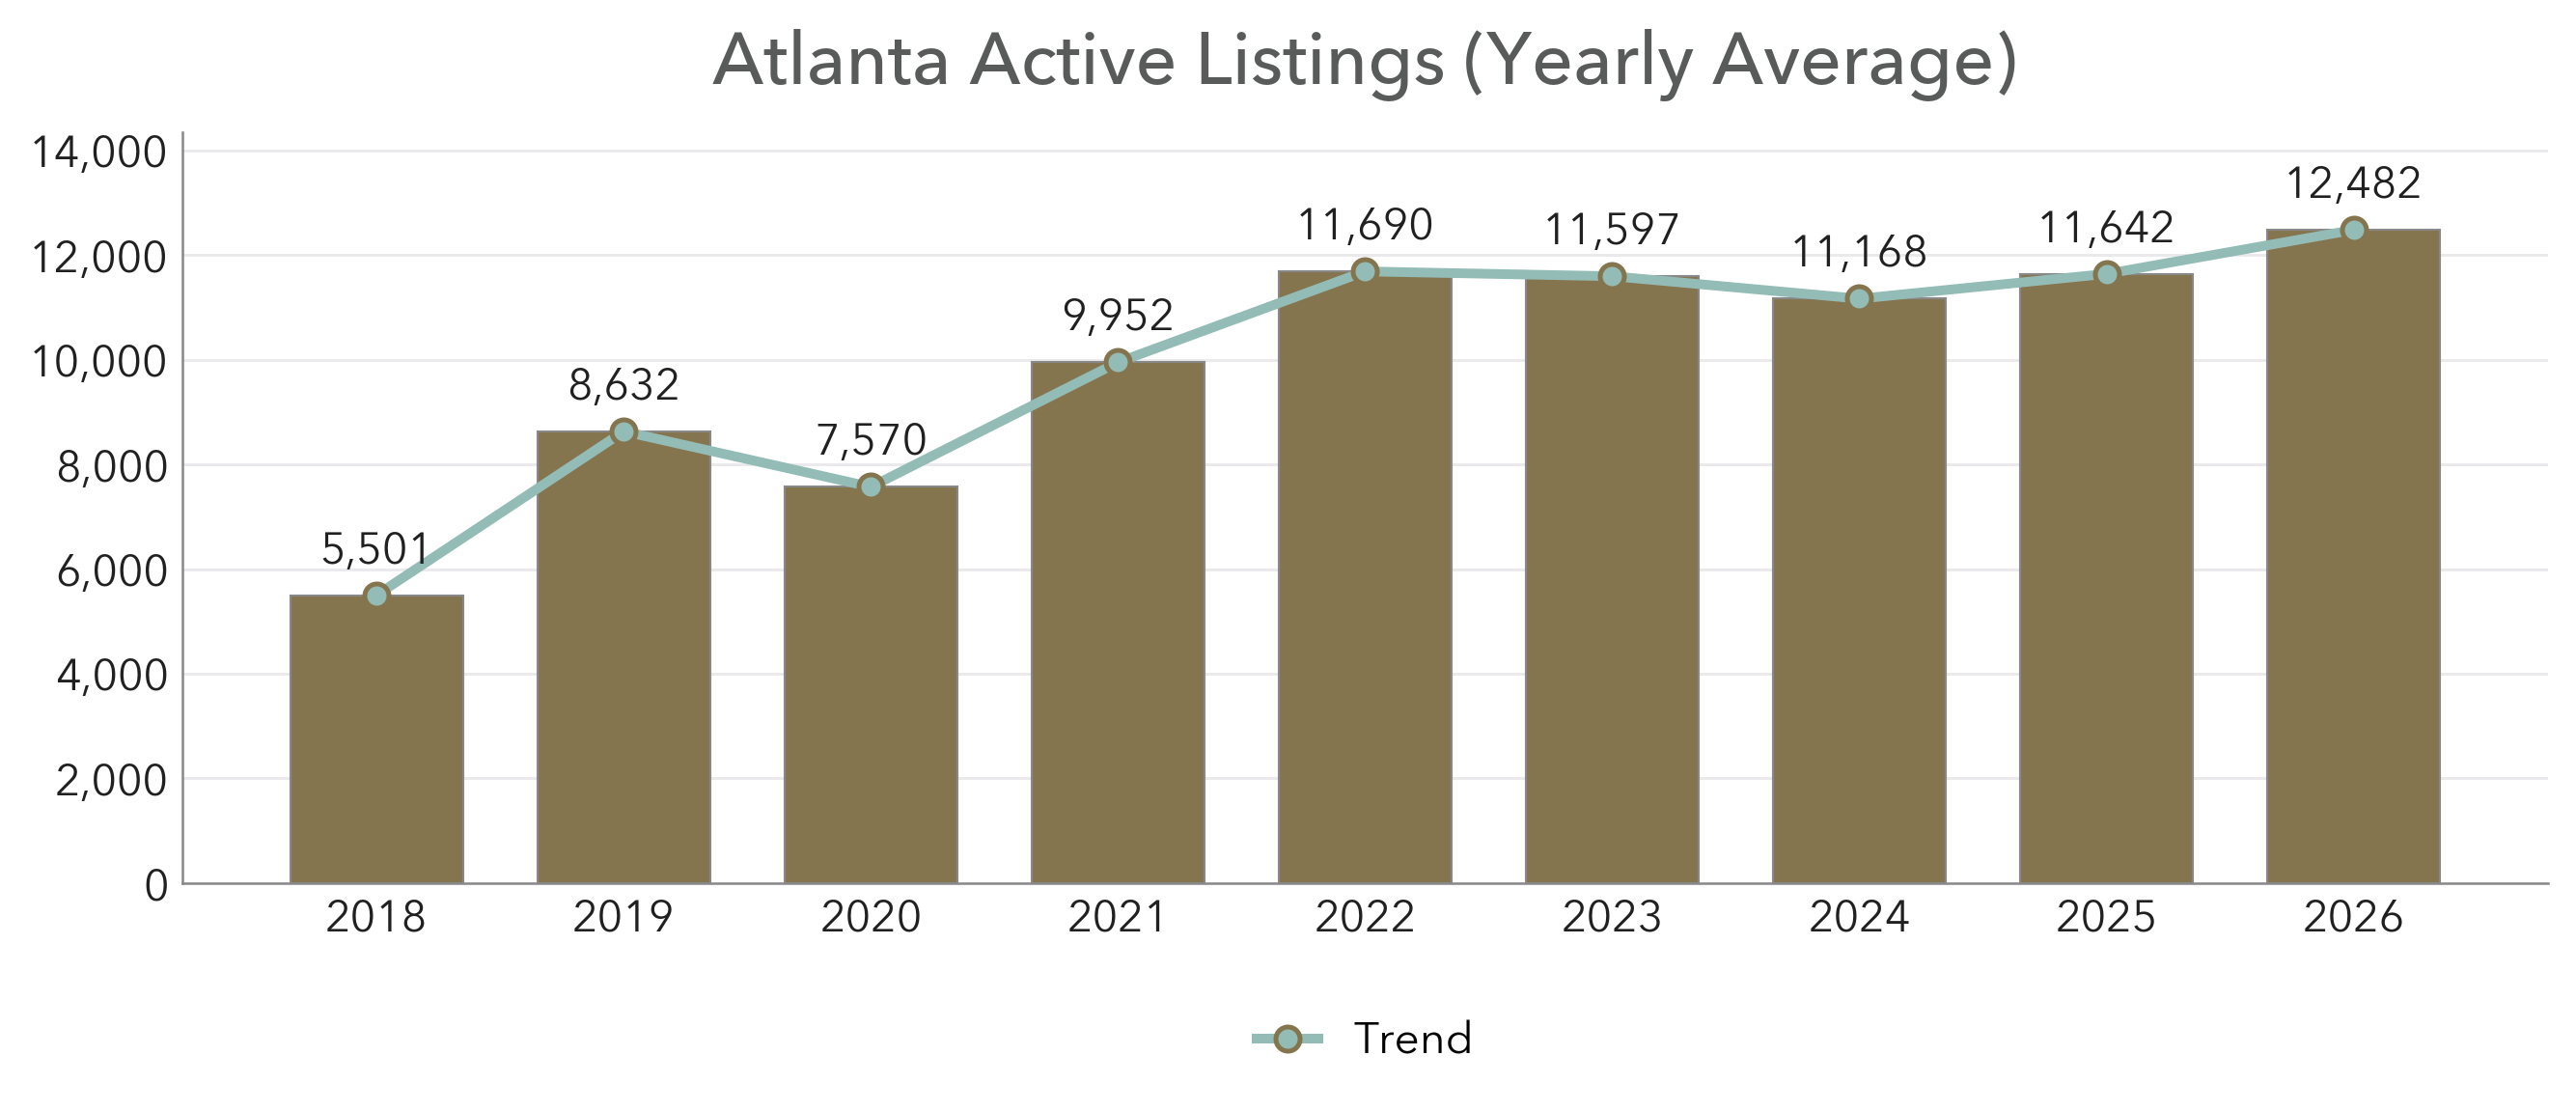
Figure 1. Atlanta active listings, yearly average. All bedroom configurations.
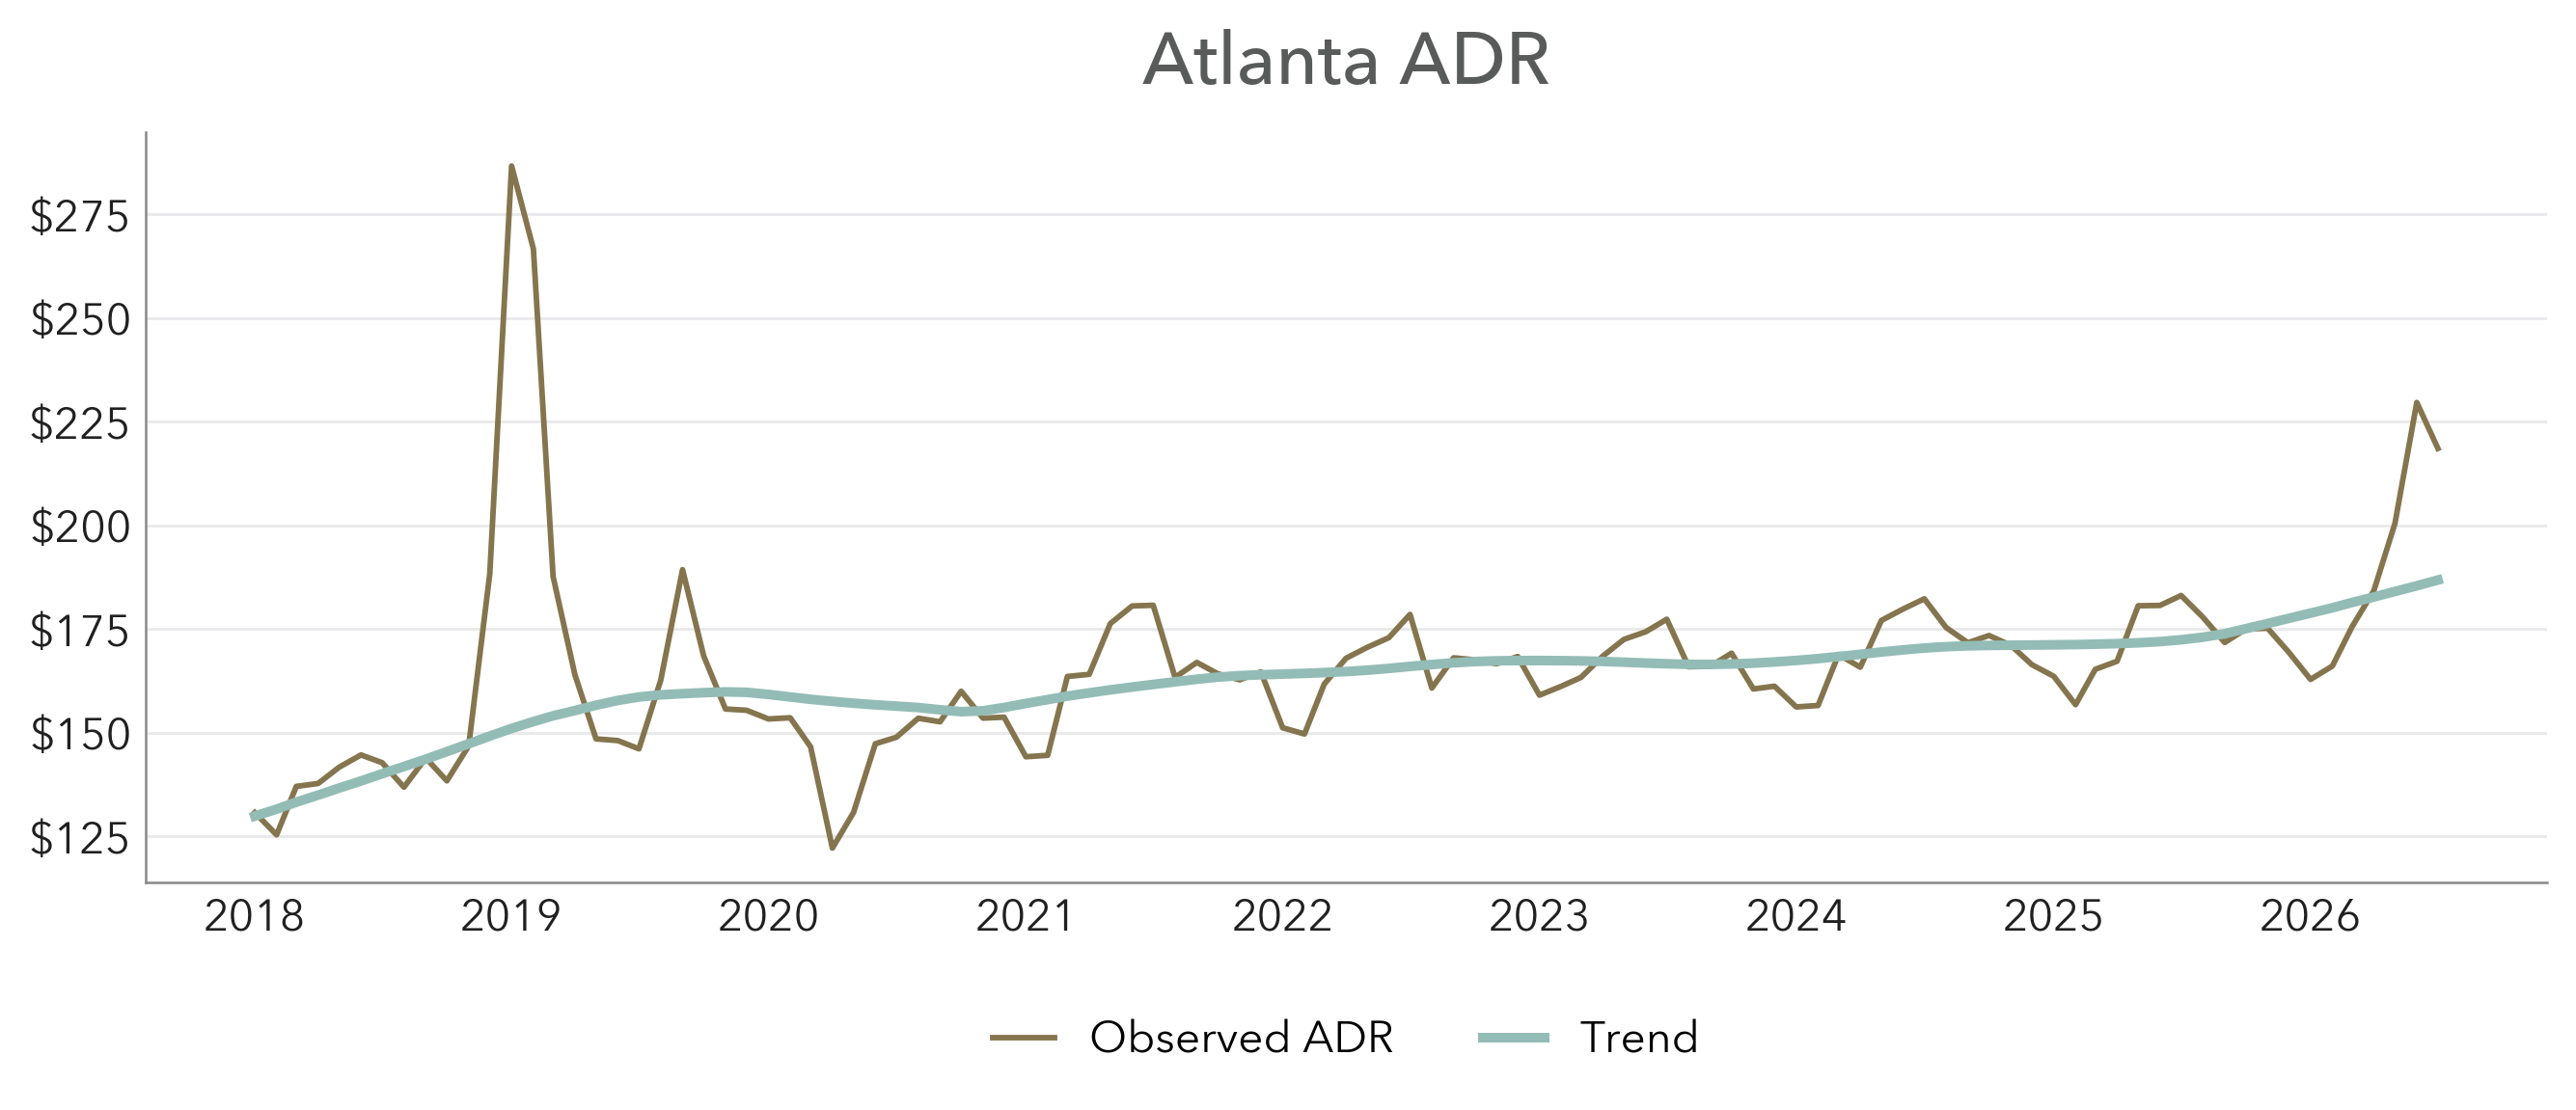
Figure 2. Atlanta market ADR trend. All bedroom configurations.
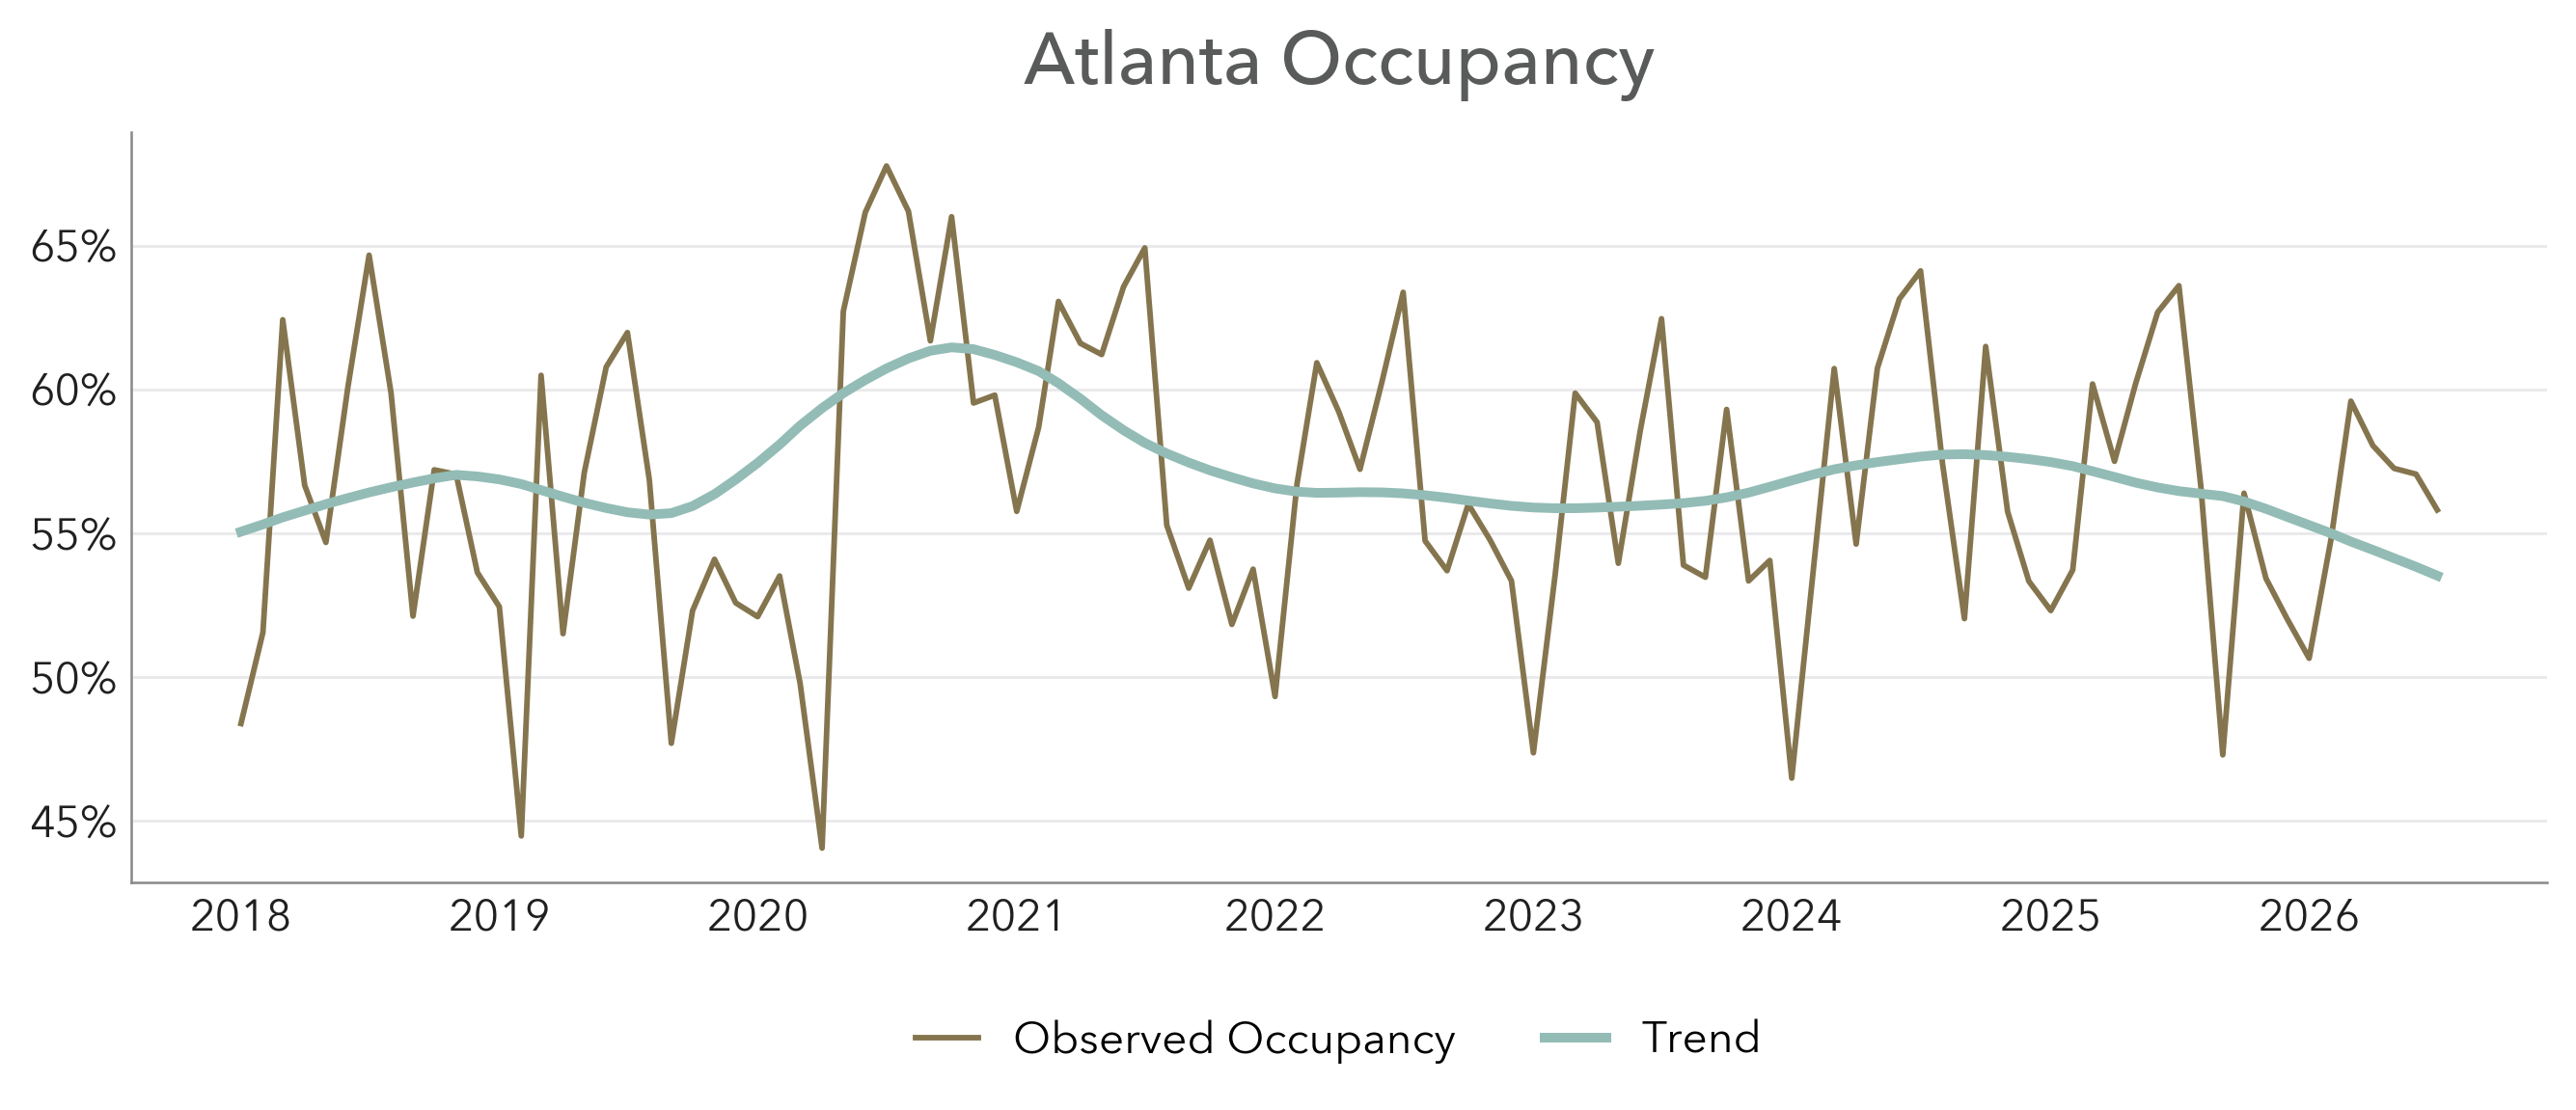
Figure 3. Atlanta market occupancy trend. All bedroom configurations.
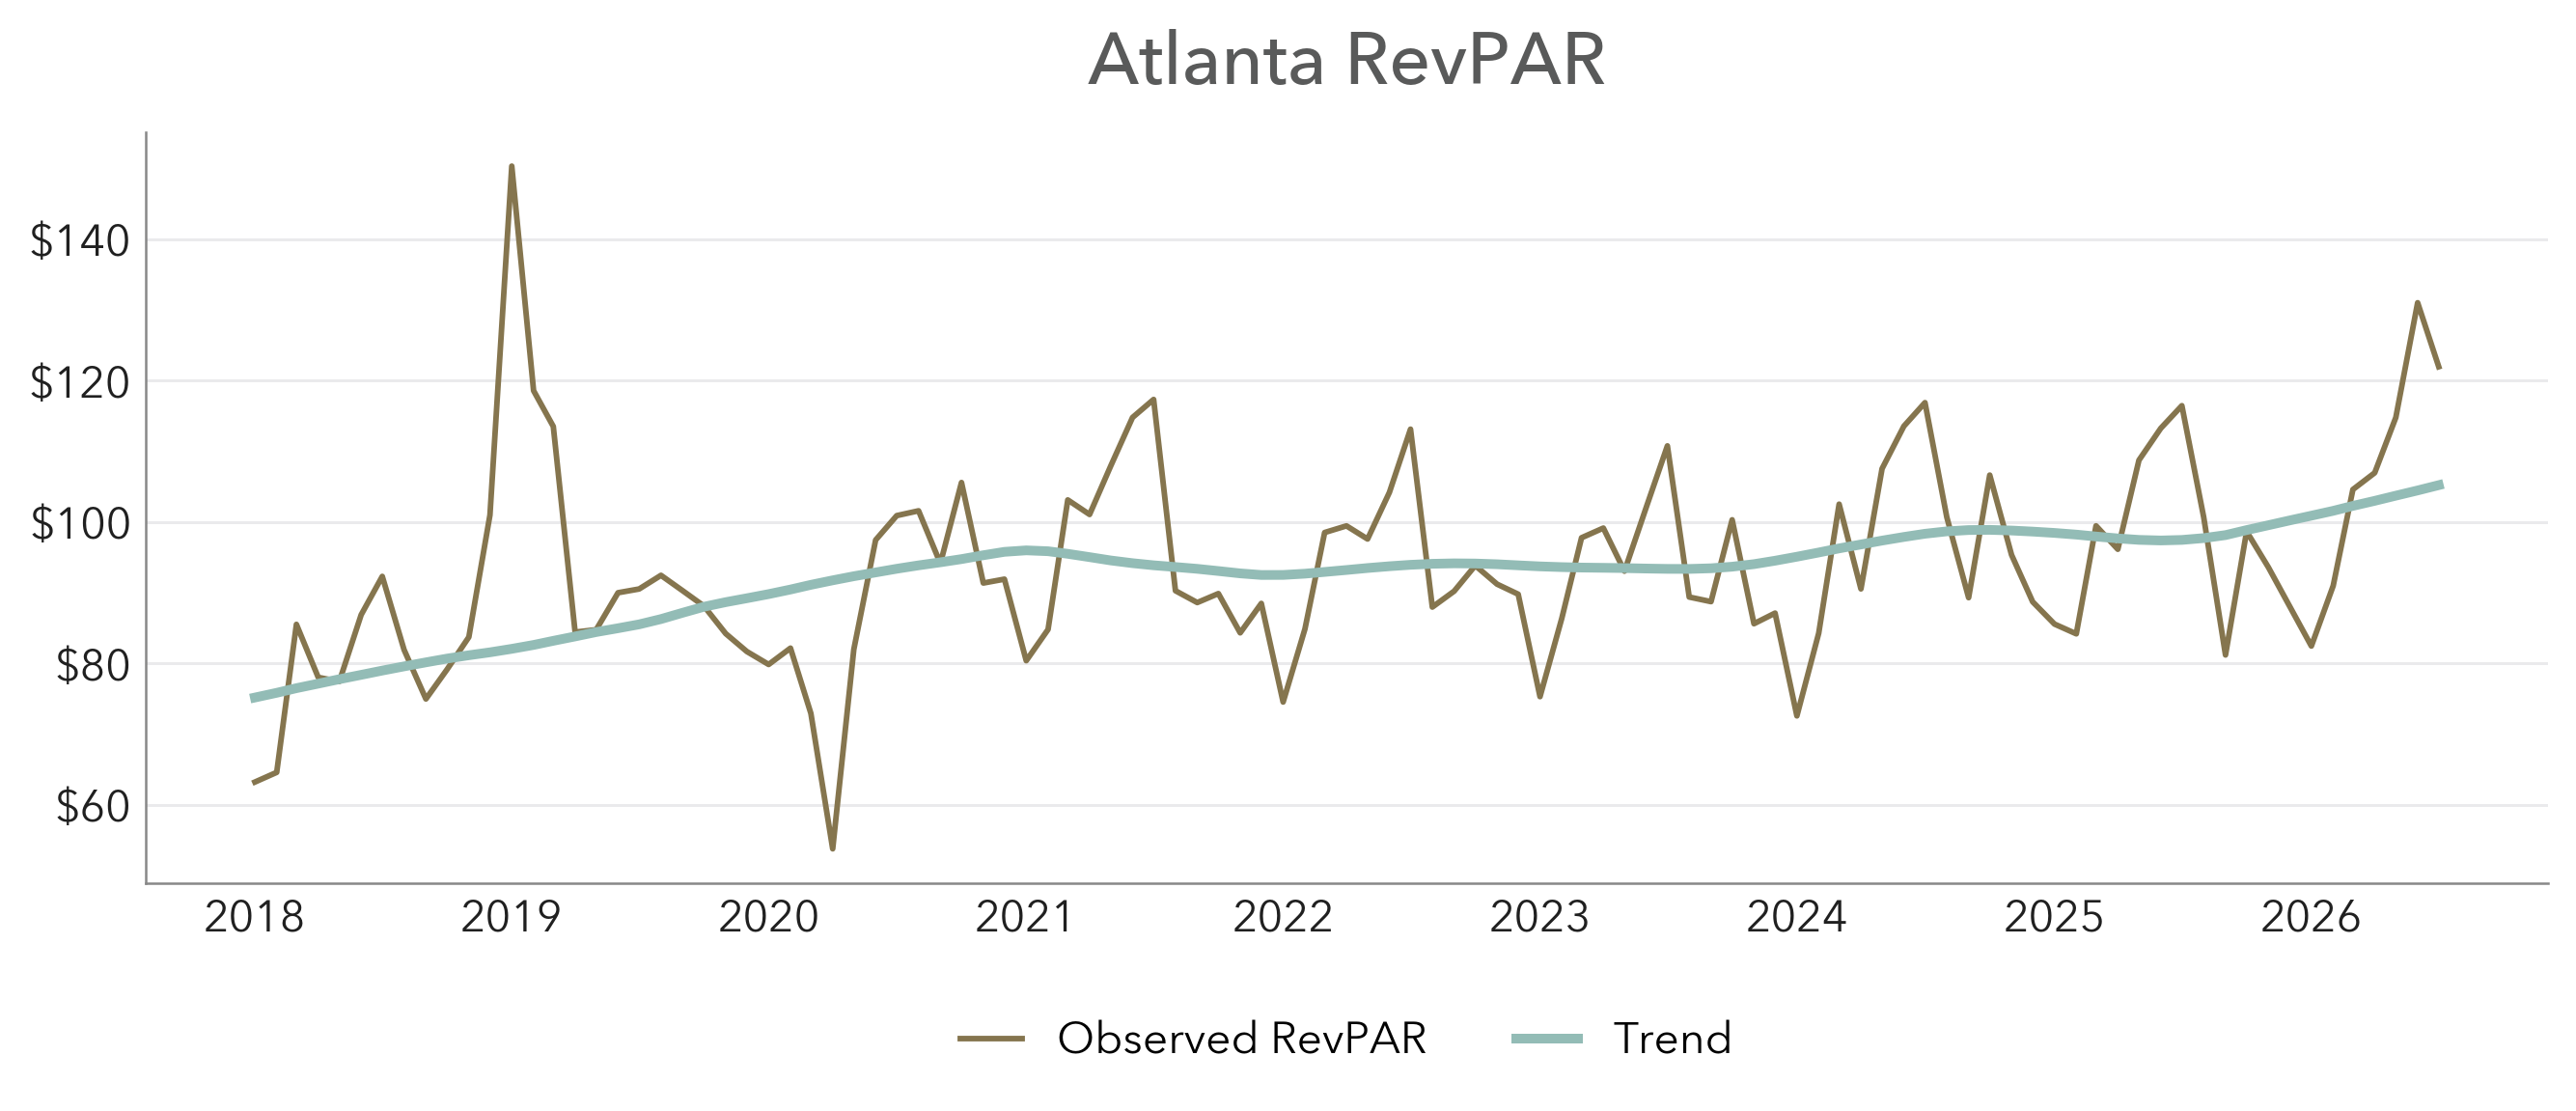
Figure 4. Atlanta market RevPAR trend. All bedroom configurations.
Figures 1 through 4 show how the result was produced. Supply increased into 2026, and ADR reached a level exceeded in this series only by the 2019 Super Bowl. Occupancy declined despite the tournament schedule. Because RevPAR equals ADR multiplied by occupancy, the combination produced a high but narrow June RevPAR increase that weakened as the tournament moved into July.
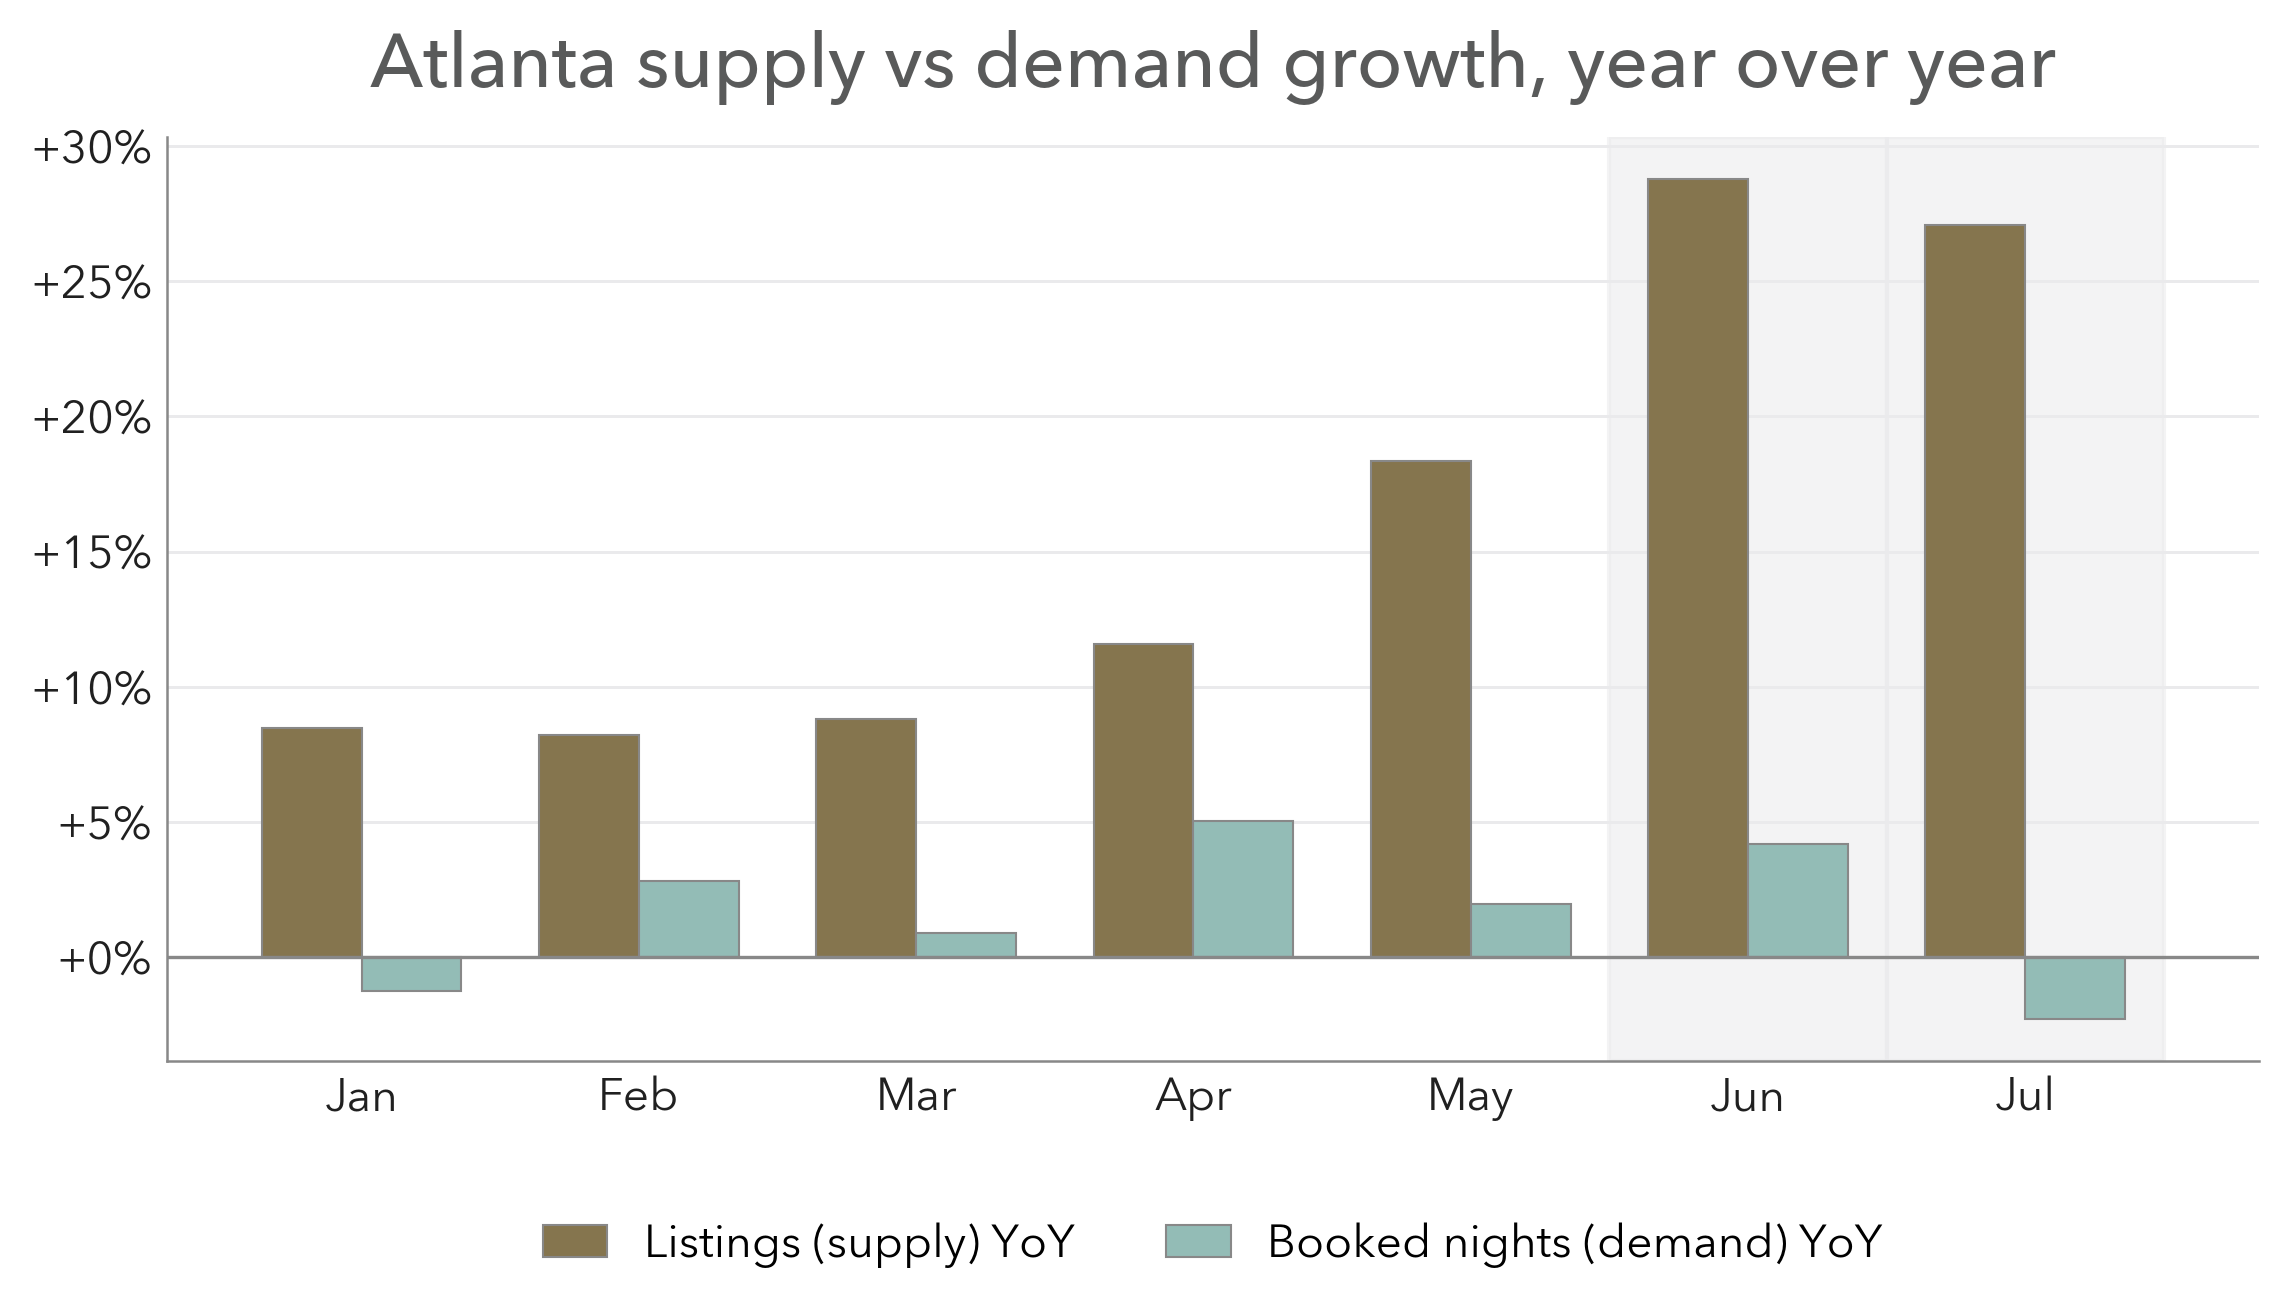
Figure 5. Atlanta listing growth versus booked-night growth, year over year. World Cup months shaded.
Figure 5 compares the growth in listings with the growth in booked nights. Supply growth exceeded demand growth in every month of 2026, and the gap widened from roughly 9 percentage points in January to approximately 25 points in June. By July, booked-night growth had turned negative while listings remained 27.1% above the prior year.
Market RevPAR increased 15.7% year over year in June but only 4.7% in July, while supply remained roughly 27% above last year. Because occupancy fell through the knockout stage, June's result came primarily from higher rates rather than additional booked nights. I would therefore treat the World Cup result as a temporary pricing benefit, rather than evidence that Atlanta's underlying STR demand increased.
July occupancy was 55.8%, down 7.8 percentage points from last year and the lowest July in the nine-year series. The comparable figures were 62.5% in July 2023, 64.1% in 2024, and 63.6% in 2025. That comparison is unusually weak because July has historically been Atlanta's strongest month and hosted three knockout-stage matches this year. Supply increased faster than booked nights even with that event demand, which is the clearest evidence in this report that the market added more inventory than it could absorb.
Performance by Bedroom Configuration
The supply increase and the corresponding demand result varied by property configuration. The July year-over-year comparisons are below:
| Segment | Listings | Booked nights | Occupancy | ADR | RevPAR |
|---|---|---|---|---|---|
| 1-bed | +15.1% | −4.8% | −8.3pt | +19.0% | +3.7% |
| 2-bed | +20.2% | −3.0% | −7.0pt | +16.3% | +3.6% |
| 3-bed | +32.3% | −0.4% | −7.9pt | +17.1% | +2.5% |
| 4-bed | +35.9% | −0.4% | −9.0pt | +20.3% | +3.2% |
| 5-bed+ | +30.7% | +7.8% | −4.0pt | +21.0% | +12.4% |
The supply increase was largest among three- and four-bedroom homes, where listings grew 32.3% and 35.9%, respectively. Booked nights declined 0.4% in both segments, so their modest RevPAR gains came from higher rates rather than additional demand. Owners in these configurations were competing against roughly one-third more homes for essentially the same number of booked nights.
Five-bedroom-plus homes were the exception in July: booked nights increased 7.8% and RevPAR increased 12.4% despite 30.7% more listings. Demand was flat or lower in every one- through four-bedroom segment, so owners should not apply the five-bedroom result to smaller properties. The configuration data supports a narrow exception rather than a market-wide recovery.
Minty's World Cup
We calculate portfolio RevPAR as revenue earned per available unit-night, counting every managed unit whether that night booked or not. AirDNA uses the benchmark's stated availability basis. We can compare movement over the same period and report the displayed gaps, but the absolute level comparison remains directional until the underlying availability definitions are reconciled from raw data.
| Configuration | May (pre-tournament) | June (group stage) | July (knockout stage) | July vs May |
|---|---|---|---|---|
| 1-bedroom | $96.28 | $102.08 | $91.65 | −4.8% |
| 2-bedroom | $119.91 | $146.03 | $141.50 | +18.0% |
| 3-bedroom | $172.58 | $194.65 | $199.04 | +15.3% |
| 4-bedroom | $237.49 | $296.14 | $255.71 | +7.7% |
| Portfolio | $133.77 | $155.54 | $147.13 | +10.0% |
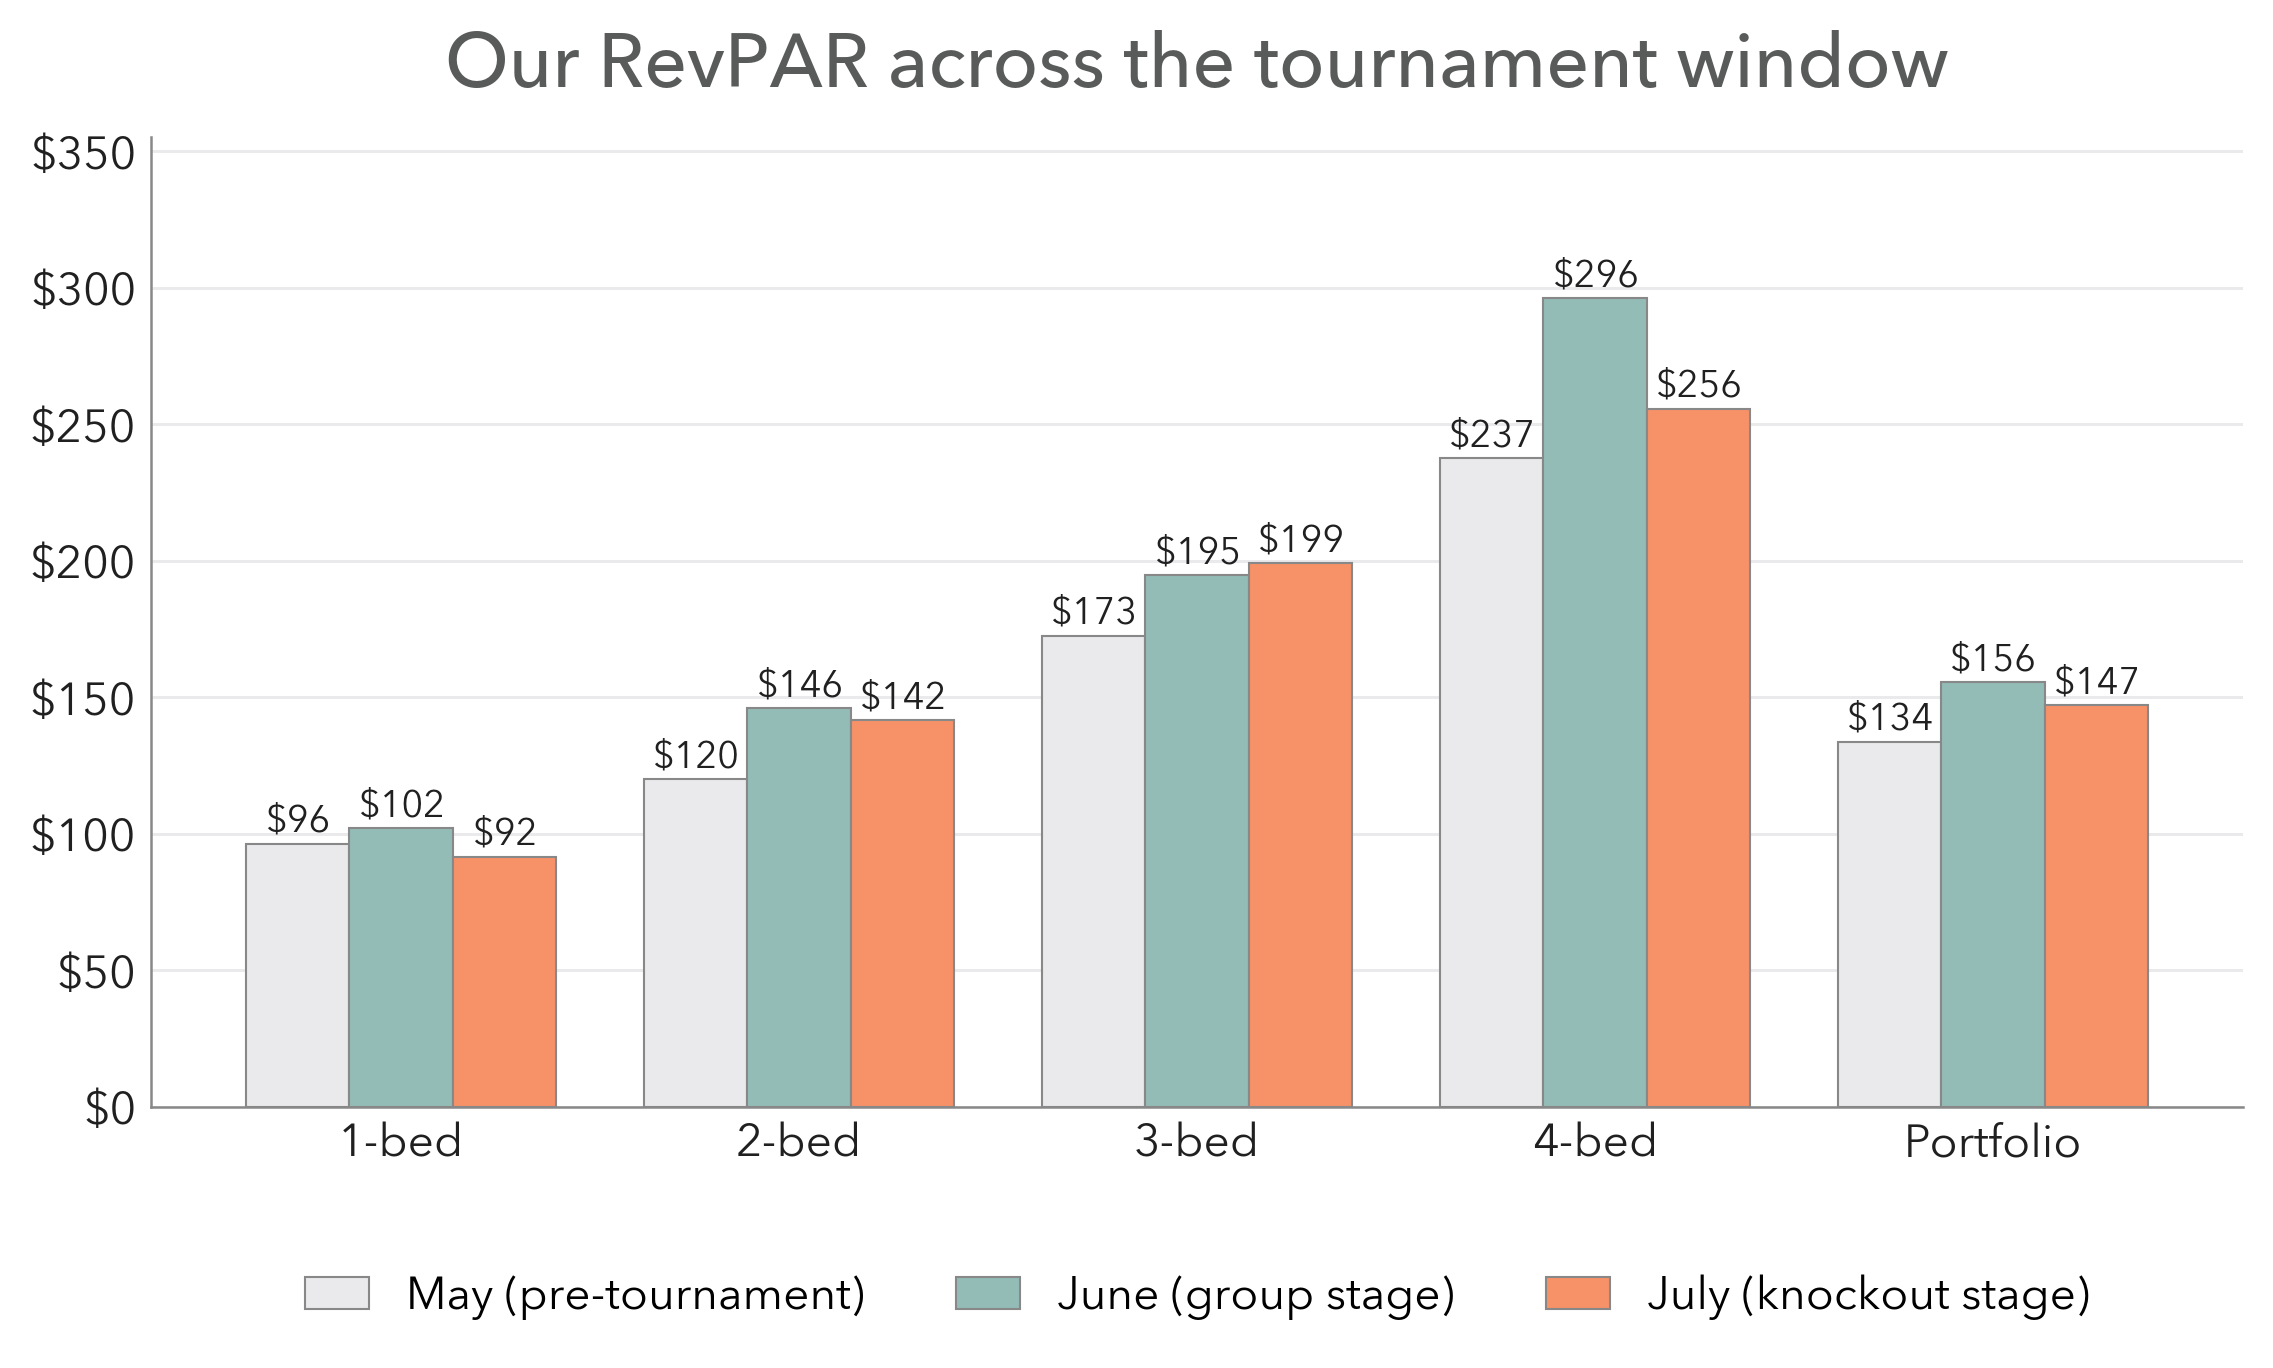
Figure 6. Our RevPAR by bedroom configuration, May to July 2026.
The group stage lifted portfolio RevPAR 16% above its May base. Through the knockout rounds, we retained 61% of that increase and finished July 10.0% above May. On its own stated availability basis, the Atlanta market retained 44% of its increase and finished July 6.6% above May.
The configuration results explain where our retained performance came from. Two-bedroom RevPAR finished July 18.0% above May and retained 83% of its June increase. Three-bedroom RevPAR finished at $199.04, 15.3% above May and higher than its June result. These configurations already serve relocation, corporate, insurance-placement, and medical stays, so their performance is consistent with demand that extends beyond the tournament window.
One- and four-bedroom homes were weaker against their own May results. One-bedroom RevPAR finished July 4.8% below May. Four-bedroom RevPAR remained 7.7% above May but retained less than one-third of its June increase. The data supports different pricing and stay-length decisions by configuration rather than one portfolio-wide response.
Comparison with the Atlanta market
| Configuration | May | June | July |
|---|---|---|---|
| 1-bedroom | +25% | +12% | +12% |
| 2-bedroom | +21% | +23% | +28% |
| 3-bedroom | +34% | +34% | +46% |
| 4-bedroom | +34% | +54% | +38% |
| Portfolio | +23% | +24% | +26% |
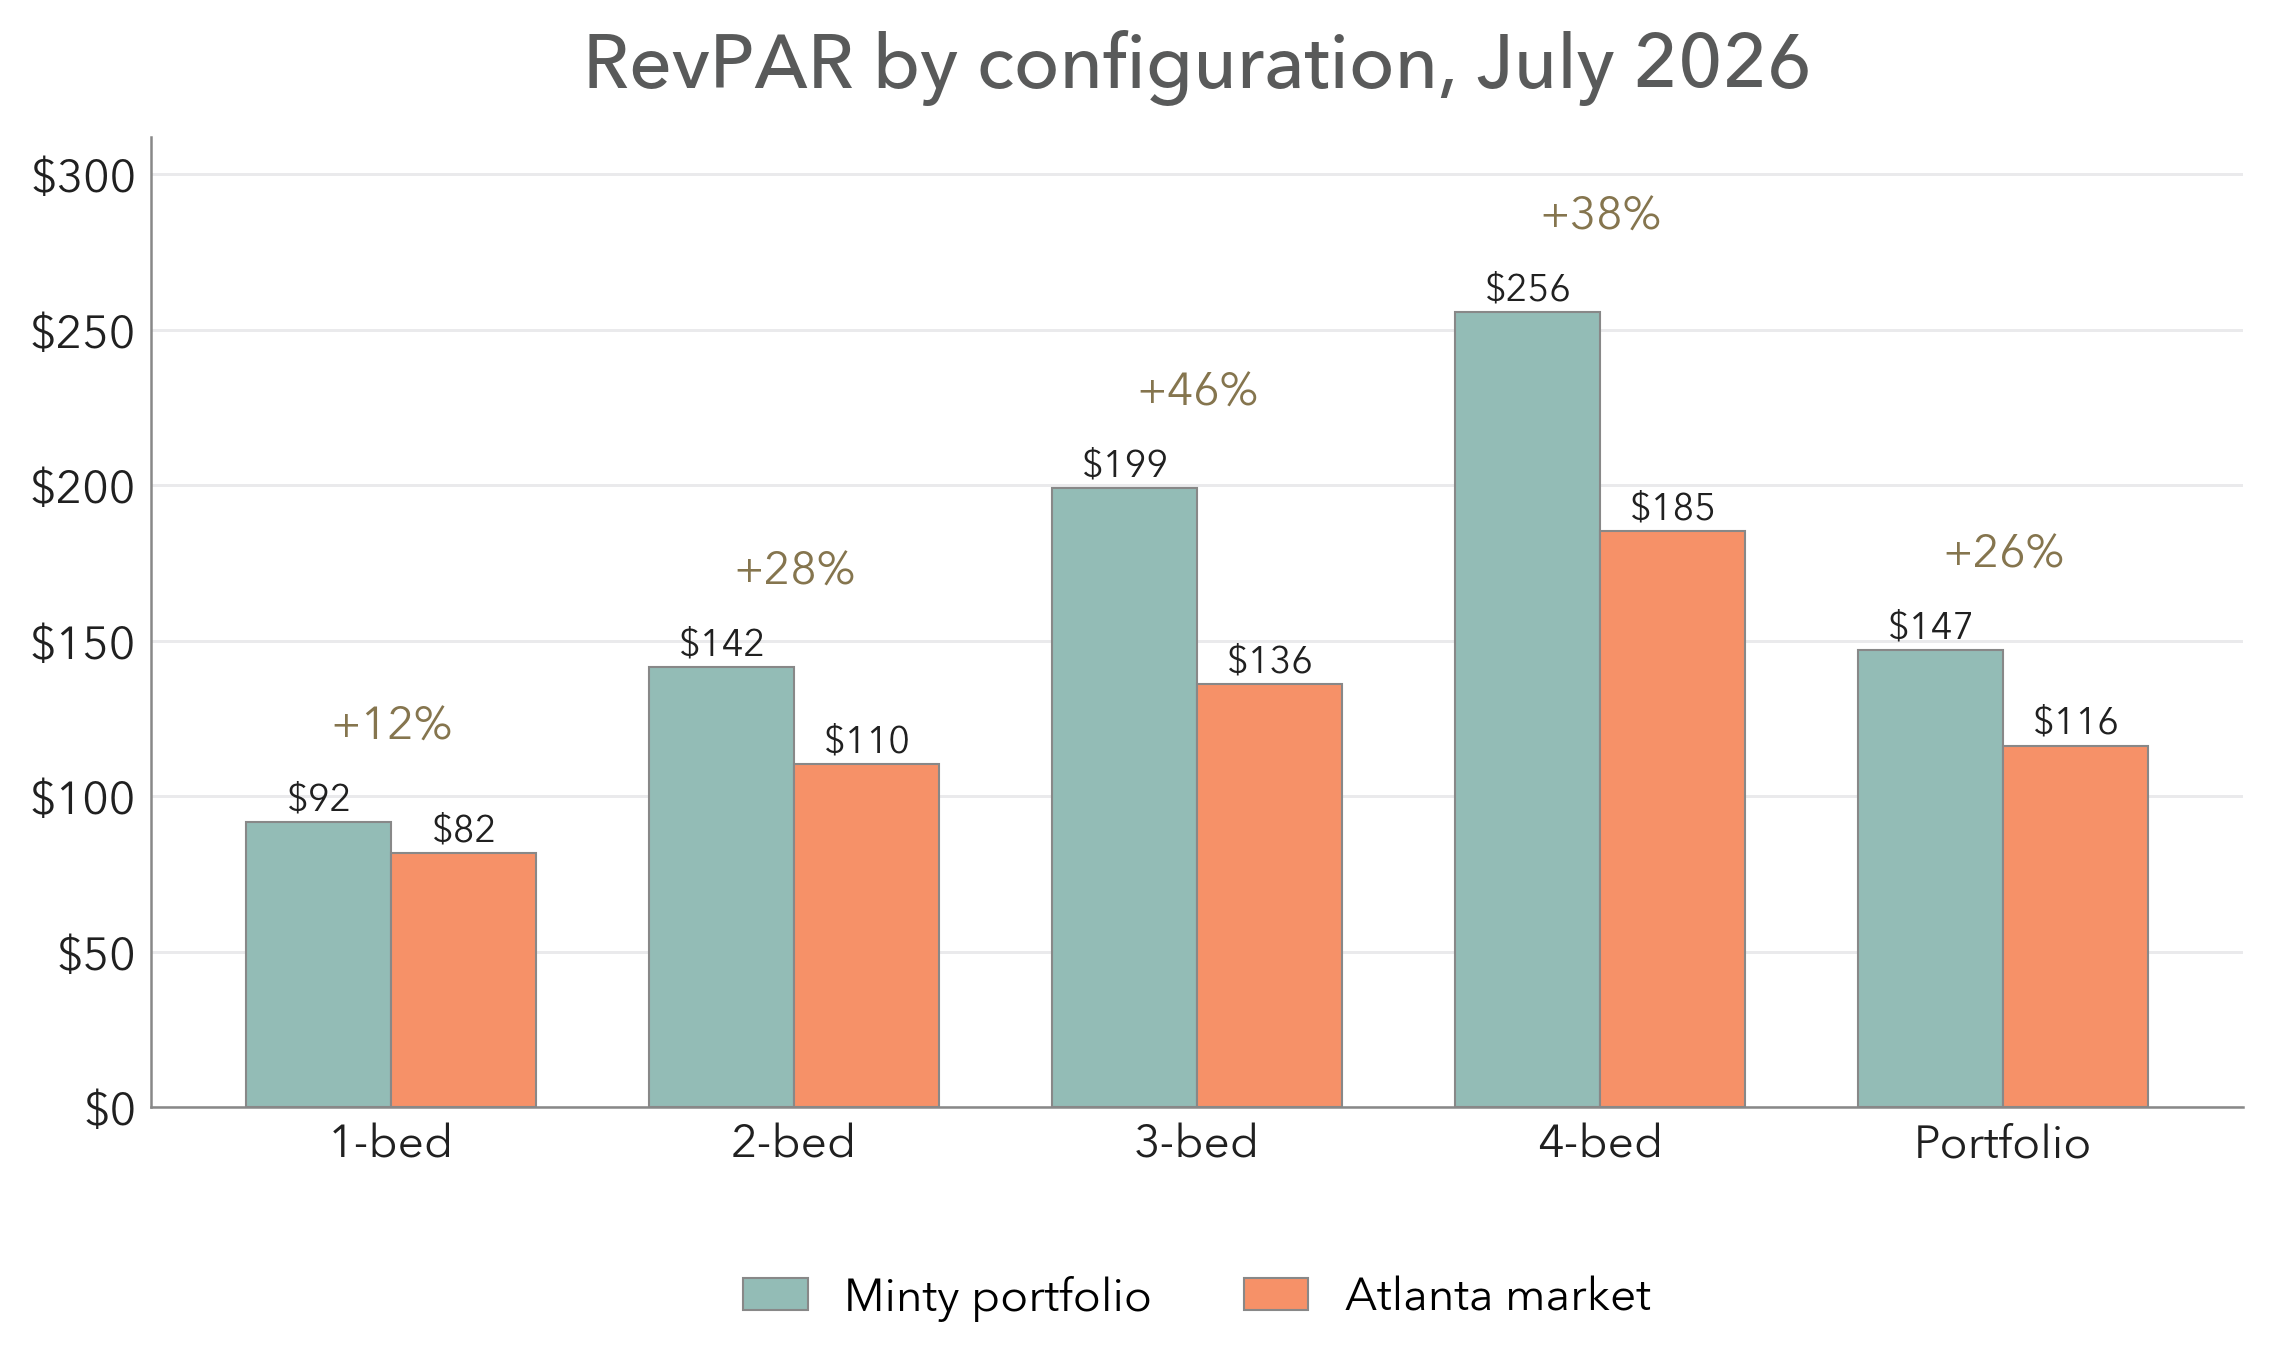
Figure 7. RevPAR by bedroom configuration, our portfolio against the Atlanta market, July 2026.
Displayed Minty RevPAR exceeded the market series in every reported configuration in May, June, and July. The directional portfolio gap increased from 23% in May to 24% in June and 26% in July. That widening matters because July was also the month in which market occupancy and booked-night demand weakened most. Our portfolio did not avoid the effect of the additional supply, but it retained more of the event-period gain when each series is measured against its own May baseline.
Rate and occupancy
RevPAR combines rate and occupancy, so we separate those components before deciding how to respond.
| ADR, comparable stays | May | June | July |
|---|---|---|---|
| Minty portfolio | $294.20 | $307.18 | $244.99 |
| Atlanta market | $189.78 | $218.85 | $207.78 |
| Lead | +55% | +40% | +18% |
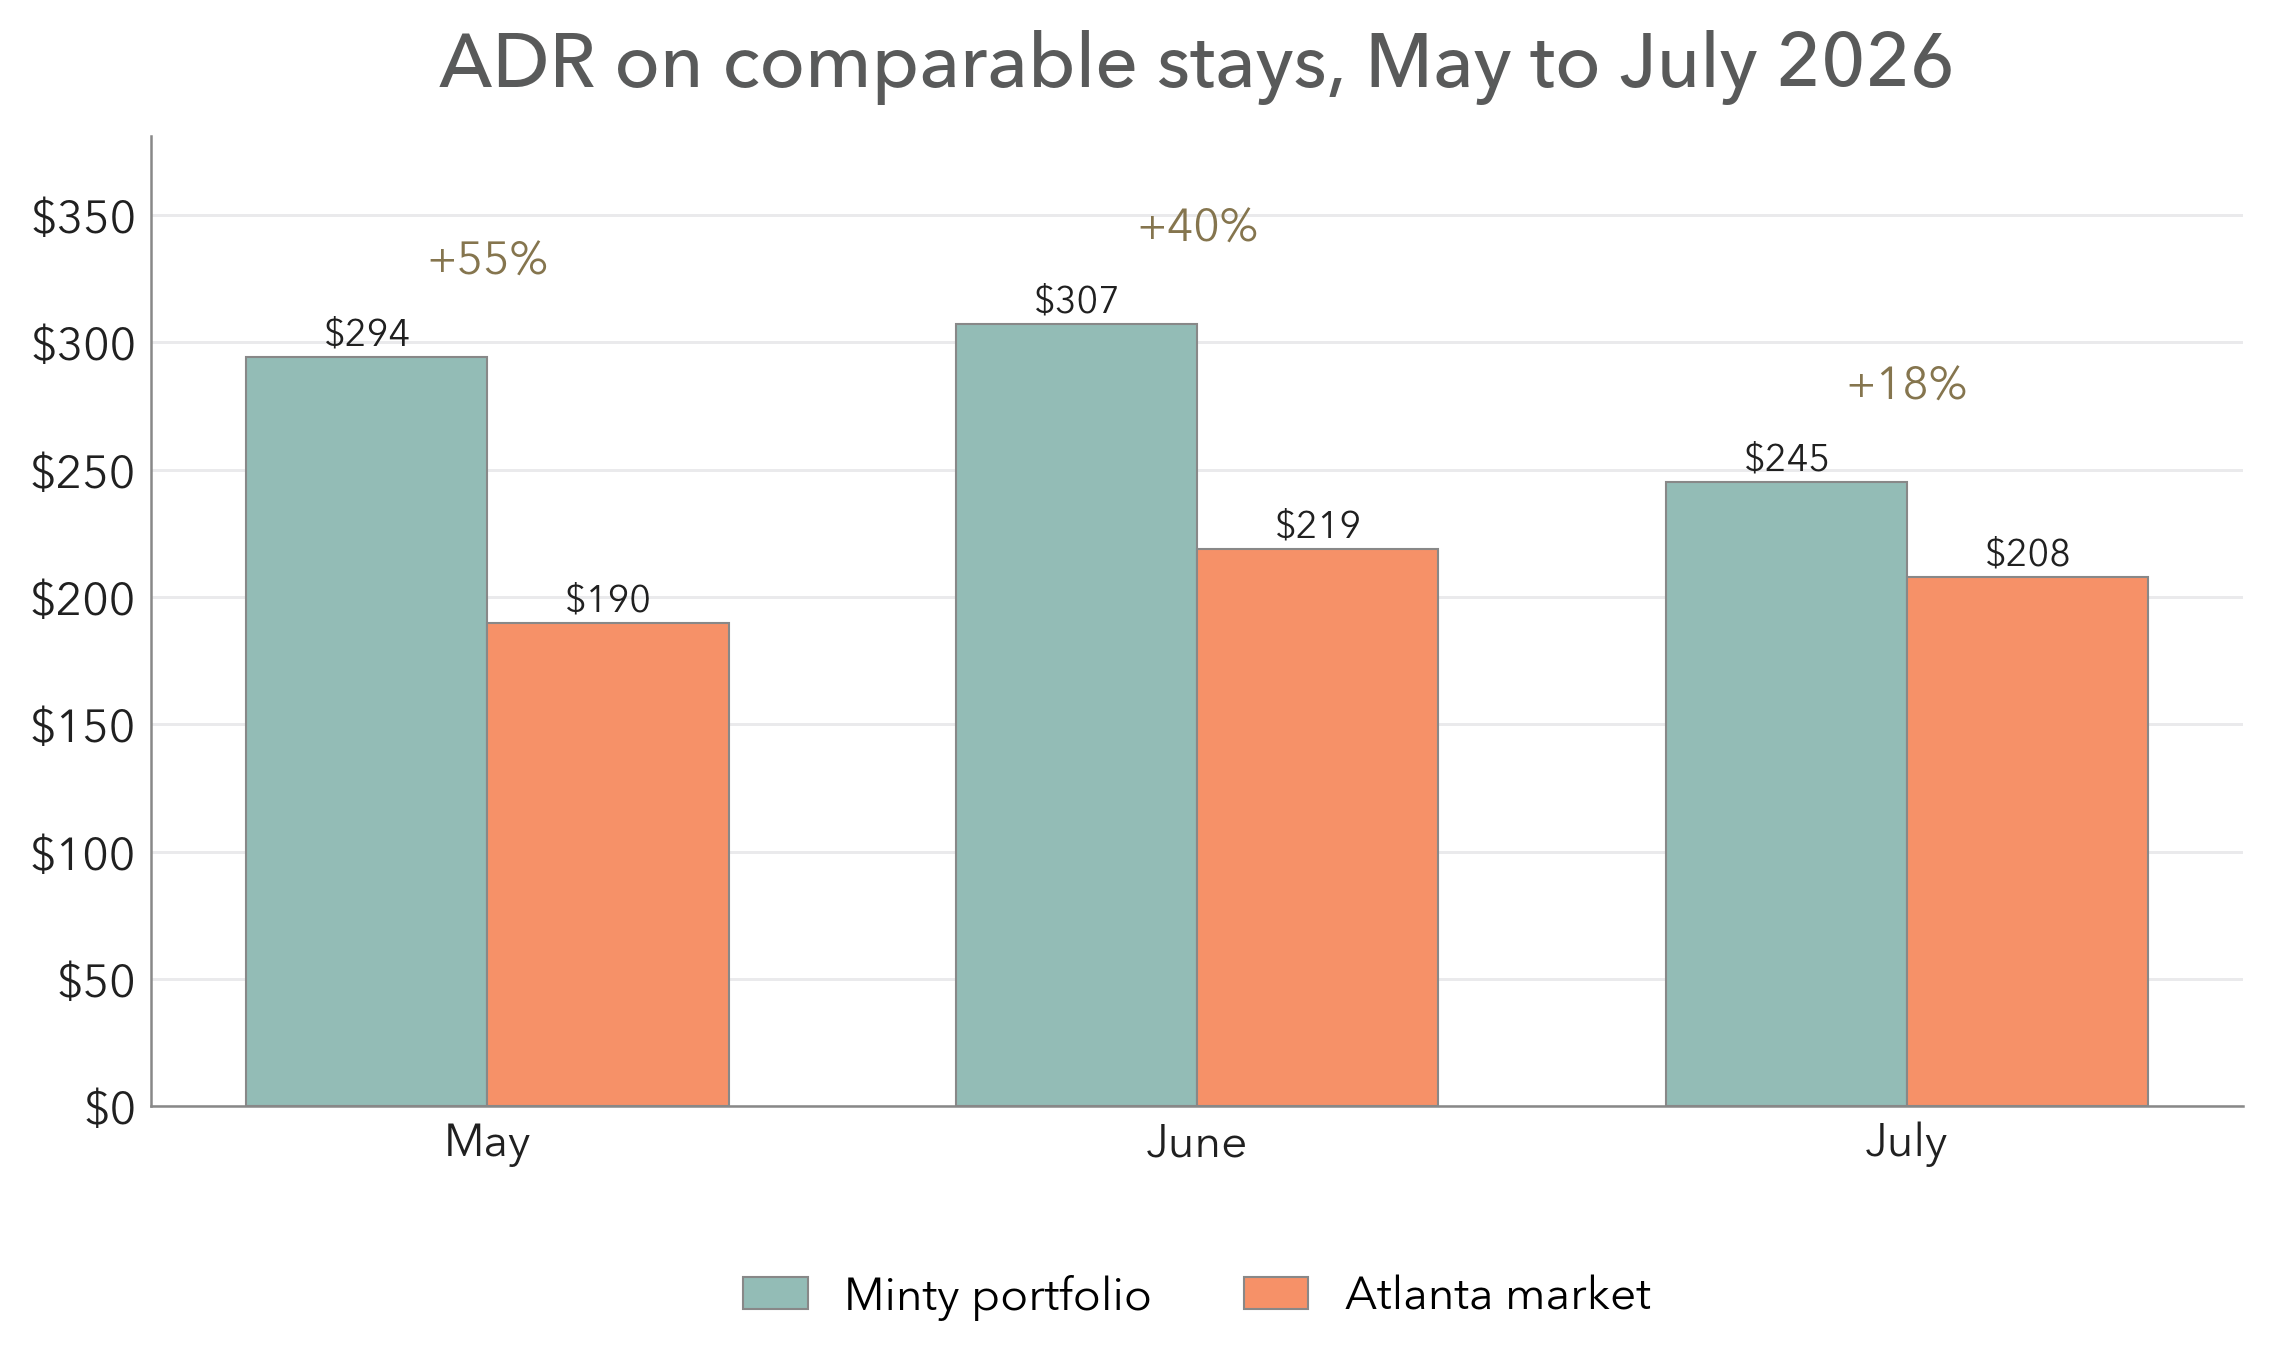
Figure 8. Average daily rate on comparable stays, our portfolio against the Atlanta market.
| Occupancy | May | June | July |
|---|---|---|---|
| Minty portfolio | 68.5% | 77.2% | 74.5% |
| Atlanta market | 57.5% | 57.3% | 56.0% |
| Lead | +11pt | +20pt | +18pt |
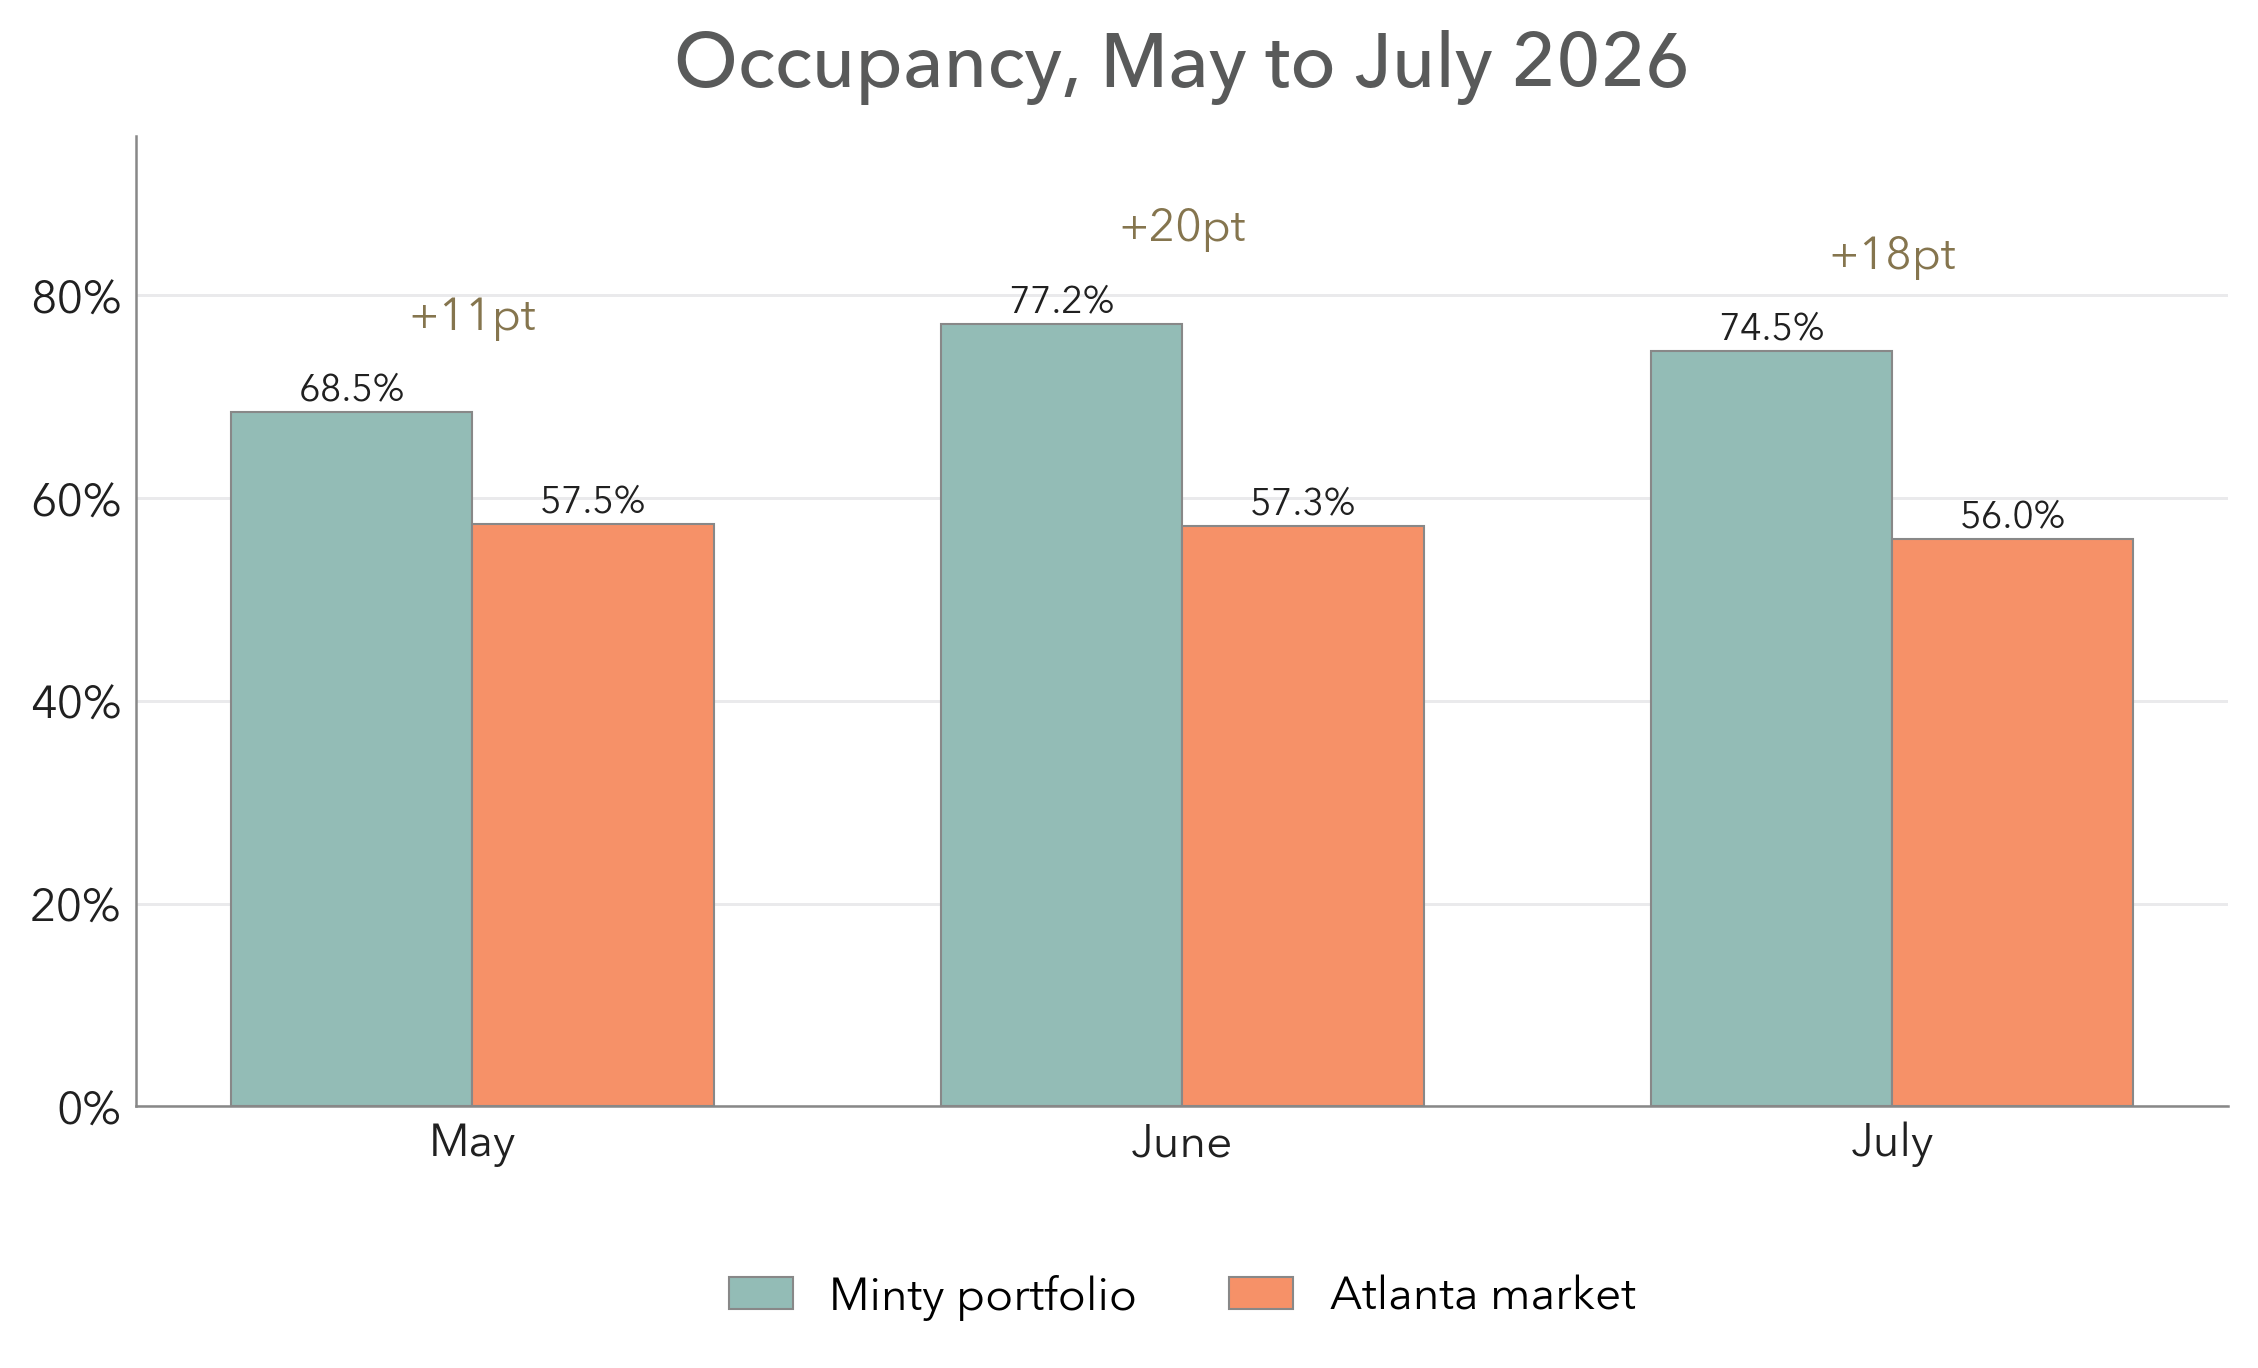
Figure 9. Occupancy, our portfolio against the Atlanta market.
Our portfolio remained ahead on both displayed measures in each month. July occupancy was 74.5%, compared with 56.0% for the Atlanta benchmark, while ADR on comparable stays was $244.99 versus $207.78. Together, those displayed results produced a 26% RevPAR gap. Because the occupancy denominators differ, the level comparison remains directional until the raw source definitions are reconciled.
The ADR lead narrowed from 55% in May to 18% in July, which is consistent with more listings competing for fewer booked nights. Our occupancy declined 2.7 percentage points from June to July, compared with a 1.3-point decline for the market, but the portfolio still maintained an 18.5-point occupancy lead in July. We are responding to the rate pressure by protecting occupancy and term rather than waiting for event pricing to return.
Three-bedroom homes produced the strongest relative result, finishing July 46% above the displayed benchmark. One-bedroom homes were the weakest segment against their own May base, but they still finished 12% above the displayed market series. That distinction matters: the one-bedroom issue is deterioration relative to its own recent performance. The market-relative gap is useful directional context, not a reconciled like-for-like level comparison.
The Supply Outlook
Atlanta recorded 19,335 total listings in July, compared with 15,213 one year earlier. The supplied AirDNA summary does not define that measure as an end-of-month active-inventory snapshot, so it cannot establish how many listings remained active on July 31. It does establish that the market carried 27.1% more listings during a month that included the final three Atlanta matches and the period immediately after them.
We cannot observe why every owner entered the market or when each one will leave it. Our operating forecast assumes that much of the incremental inventory will remain through the autumn because furnishing, photography, listing setup, and financing create real switching costs. Owners may discount before they sell the property or return it to an unfurnished long-term rental. The source draft identifies January and February as Atlanta's seasonal occupancy floor, so our current expectation is that the greatest inventory pressure will occur between now and then. That seasonal claim and the timing of any inventory reduction require confirmation from the underlying series, and we will update the forecast as August and subsequent data become available.
If July's elevated supply persists, the next two quarters will combine more listings than last year with owners who may become increasingly willing to reduce rates. Waiting for the market to remove that inventory would expose our owners to several months of weaker occupancy. We are therefore changing rates and stay-length strategy now, while acknowledging that the amount and pace of inventory contraction remain unknown.
The Long-Stay Pivot
We are moving to low-season rates in September rather than the usual November and targeting six- and seven-month terms with a one-month penalty for early termination. This decision accepts a lower nightly rate in exchange for occupancy, term, and fewer turnovers.
The market data supports moving earlier. Market RevPAR growth narrowed from 15.7% in June to 4.7% in July, so there is little event premium left to protect. Listings remain 27.1% above last year, and we expect competition to remain elevated through the autumn. Defending a tournament rate in that environment would increase the risk of an unfilled calendar.
Our portfolio data also shows where longer stays are already working. Two- and three-bedroom homes retained 83% and more than 100% of their June RevPAR lift, respectively, and these are the configurations already serving relocation, corporate, insurance-placement, and medical demand. Extending that approach uses an existing demand channel rather than relying on a new one.
One-bedroom homes need the adjustment most. Their July RevPAR was below the May base even though it remained above the market benchmark. For those owners, a filled calendar at an achievable rate is more valuable than holding a higher nightly rate that the market is not currently paying.
The tradeoff should be explicit. A lower nightly rate reduces upside if short-stay demand recovers earlier than we expect. A six- or seven-month booking provides revenue certainty, reduces turnover and cleaning expense, and protects occupancy during the part of the calendar in which Atlanta is usually weakest. We will continue comparing each opportunity with the expected value of leaving the calendar open rather than applying the same decision to every home.
Outlook
| Signal | Our current interpretation |
|---|---|
| Market listings +27%, booked nights −2.3% | Oversupply is likely to remain the central market issue through the winter; Q1 2027 is our current forecast, not an observed endpoint. |
| Market RevPAR growth +15.7% to +4.7% in one month | The measured event-period pricing benefit weakened materially in July, so we will not underwrite future months at tournament rates. |
| July market occupancy 55.8%, lowest in the series | The current occupancy floor is lower than recent July history would imply. |
| We retained 61% of our lift; the market retained 44% | Our portfolio preserved more of the event-period increase when each series is measured against its own May baseline. |
| Displayed portfolio gap widened: +23% to +24% to +26% | The directional gap increased as market conditions weakened; the level comparison still requires source reconciliation. |
| Three-bedroom RevPAR finished July at its three-month high | Continue directing long-stay demand toward this configuration. |
Atlanta entered August with roughly 27% more listings than a year earlier and July booked nights below the prior-year level. Our portfolio entered the same period with a displayed 26% RevPAR gap over the market series and retained more of its June increase. The first comparison is directional pending source reconciliation; the second is a within-series comparison. Together, they indicate a stronger starting position, while the supply data still argues for earlier rate adjustments and a greater emphasis on longer stays.
How Minty Living Can Help
The World Cup gave Atlanta owners an unusual pricing window and an unusually clear test of operating performance. During that period, Minty's portfolio retained 61% of its June RevPAR increase, compared with 44% for the Atlanta market. The displayed market-relative gap increased from 23% in May to 26% in July, but that level comparison remains directional until the availability definitions are reconciled.
Minty Living manages more than 160 professionally designed properties across Atlanta's intown neighborhoods. Our in-house design team is led by architect and co-founder Sidra Gross, and our eligible portfolio meets Plum Guide's "Top 1%" standard. Design supports rate, but the July results also show why rate management cannot be separated from occupancy, stay length, and the changing supply of comparable homes.
We are moving to low-season rates in September because the July data supports acting before Atlanta reaches its seasonal low. We will evaluate longer-stay opportunities against the expected value of leaving each calendar open, with different treatment for configurations whose recent demand has held and those whose performance has weakened.
Our full-service management includes design, photography, maintenance, guest communication, and revenue optimization. Minty maintains a 4.9 Google rating and Airbnb Superhost status.
If your autumn calendar is thinner than planned, we can compare your property with the relevant submarket and bedroom configuration and show how the long-stay option changes the expected revenue and occupancy tradeoff. The conversation is free, including for owners who are still evaluating their options.
Tell us about your property using this short form. You can also request a free property evaluation at owners.mintyliving.com or call (404) 999-0841.



 (4).png)

 (29).png)
 (28).png)
 (33).png)
 (37).png)
 (38).png)
 (39).png)
 (40).png)
 (44).png)
 (44).png)
 (1).png)
 (3).png)
 (55).png)
 (54).png)
 (56).png)
 (57).png)
 (58).png)
 (59).png)
 (60).png)
 (61).png)
 (63).png)
 (66).png)
 (45).png)
 (67).png)
 (68).png)
 (69).png)
 (70).png)
 (71).png)
 (72).png)
 (86).png)
 (87).png)
 (89).png)
 (92).png)