


 (66).png)
Through the first five months of 2026, the Atlanta short-term rental market - all 12,600 listings of it - averaged $106 ADR, 58% occupancy, and $62 RevPAR. Our portfolio, over the same months and the same city, ran $218 ADR, 72% occupancy, and $154 RevPAR. That is roughly 2.5x the market on RevPAR, and we cleared the metro benchmark in every single bedroom configuration.
That headline is less useful than it looks. “Beat the market by 2.5x” is a selection story, not an operating manual - it tells you we own different properties and run them differently, not what to buy next. The useful questions are narrower: where is the spread widest, where is it thin, and which configuration is quietly underperforming inside a portfolio that beats the market everywhere. The answer to the last one is the 3-bedroom, and it has been for two quarters now.
H1 2026 Atlanta STR investability: B+ / Overweight 2-bed and 4-bed; fix or exit 3-bed.
Table of Contents
Half in Review
Atlanta is a deep, competitive market, and it strengthened steadily through the half. All-bedroom market RevPAR climbed month over month - $55 in January to $67 by May - on the back of both firmer rates and improving utilization (Figures 1-4). May closed with 12,593 total listings, 7,969 of them active, against 205,486 available nights. This is not a supply-starved market where a rising tide carries every operator. It is a market where the average listing earns $62 a night and the spread between the top and bottom quartile is the whole game.
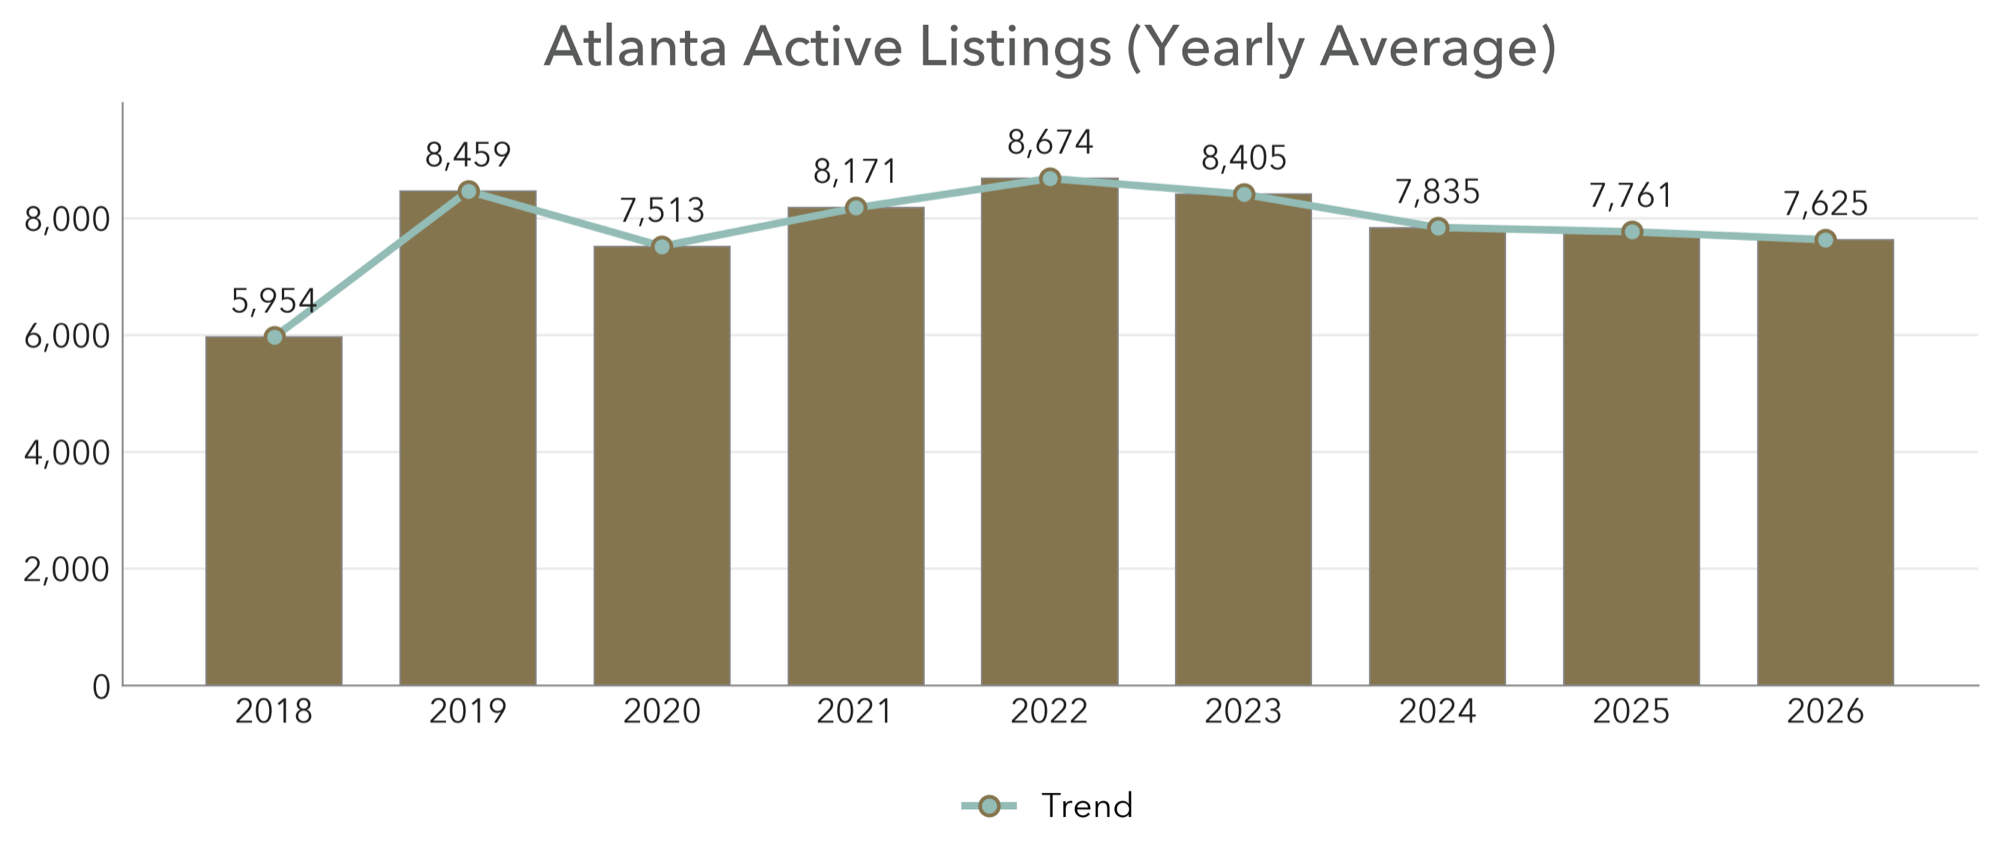 Figure 1. Atlanta active listings, full-metro AirDNA benchmark.
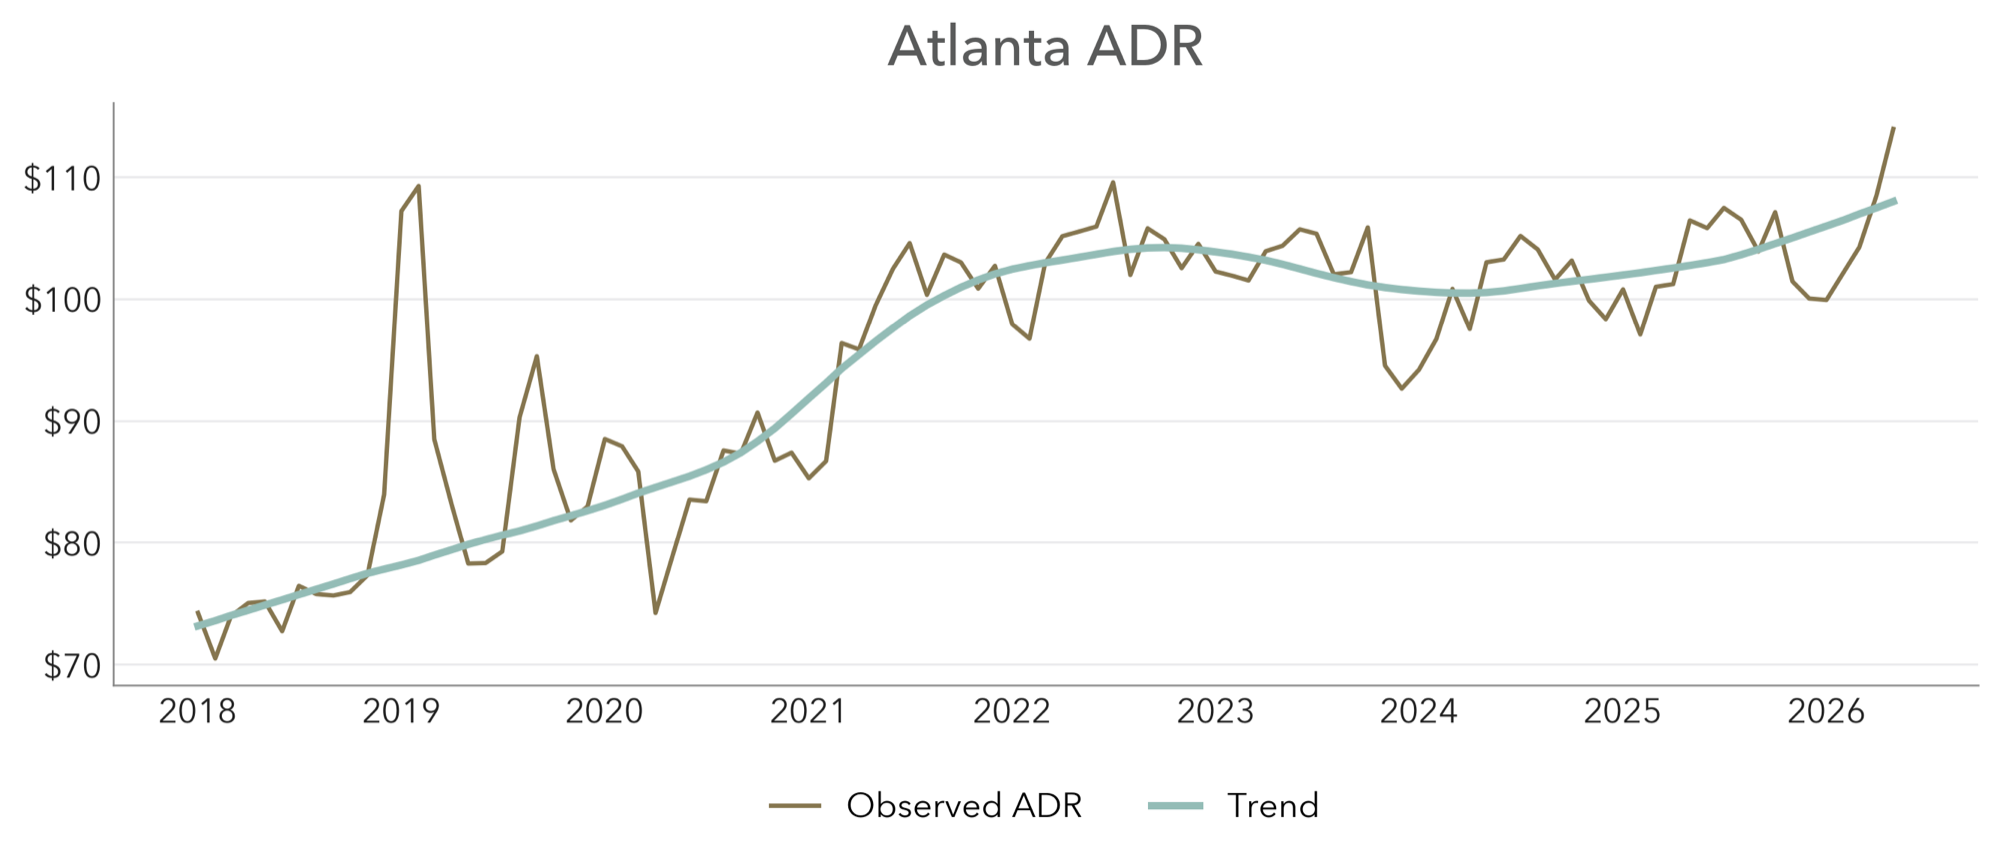 Figure 2. Atlanta market ADR trend, full-metro benchmark.
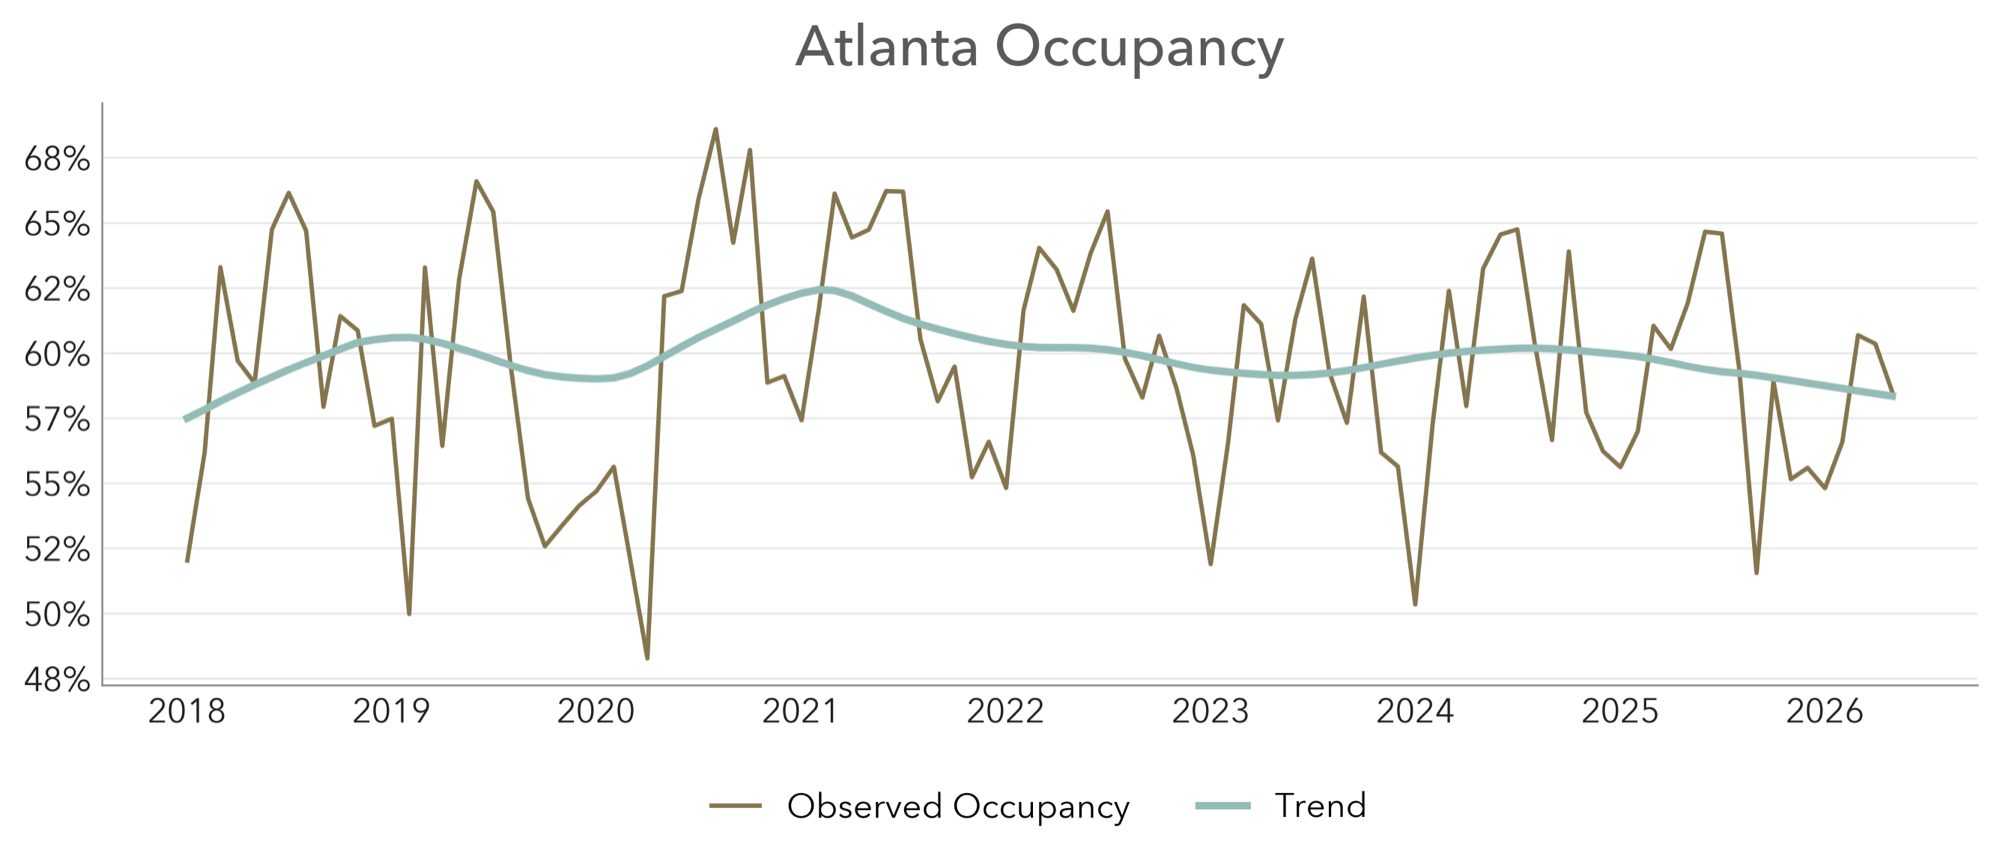 Figure 3. Atlanta market occupancy trend, full-metro benchmark.
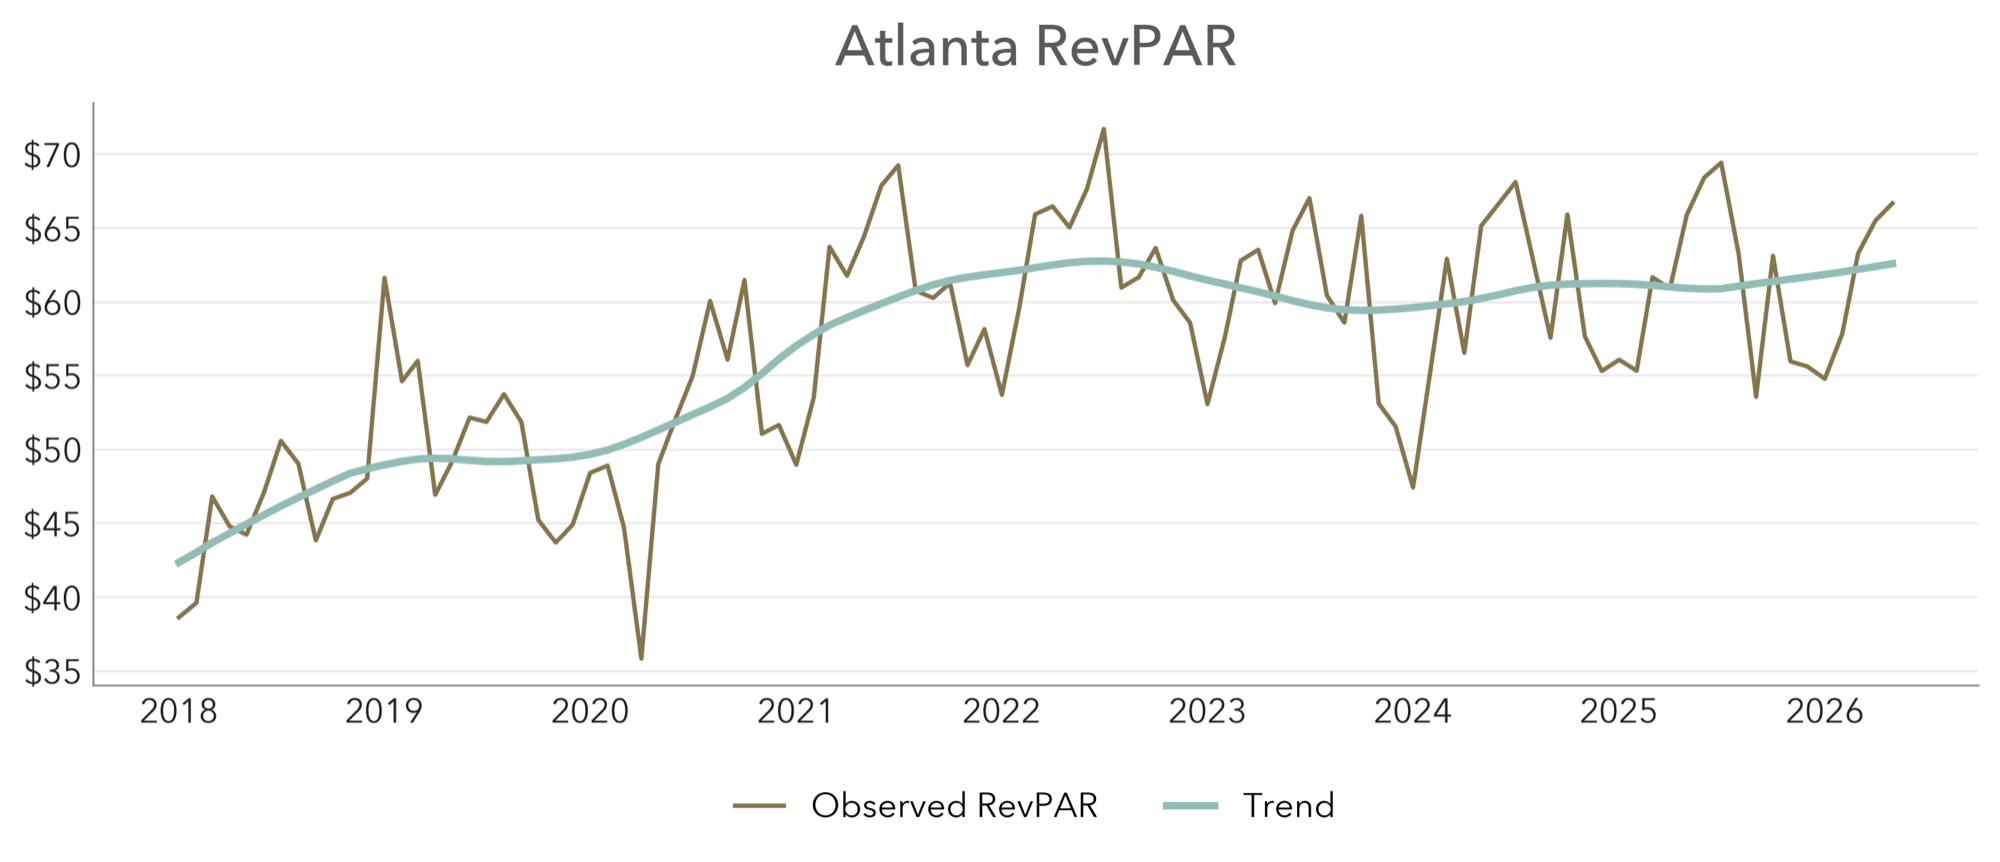 Figure 4. Atlanta market RevPAR trend, full-metro benchmark.
Read the four trend charts as one story. Supply is deep and still growing, but rate is doing the heavy lifting: ADR has compounded through the post-2022 supply expansion while occupancy holds a steady mid-50s to high-50s band, and RevPAR drifts up because pricing power, not utilization, is the lever. The market improved into May - though part of that Jan-to-May lift is Atlanta’s normal spring-into-summer seasonality as much as any structural gain, so read the monthly ramp accordingly. The market average, as always, hides more than it reveals - the configurations underneath are not moving together.
Segment Dispersion
Inside our portfolio, the first half broke into four very different stories.
| Segment | H1 Occupancy | H1 ADR | H1 RevPAR | Read |
|---|---|---|---|---|
| 1-bedroom | 77.3% | $121.91 | $94.25 | Steady urban workhorse. Floor of the portfolio. |
| 2-bedroom | 80.7% | $164.23 | $132.63 | Strongest utilization. The flexible-lodging engine. |
| 3-bedroom | 63.5% | $216.18 | $137.86 | Weakest occupancy. Carries on rate, not utilization. |
| 4-bedroom | 67.8% | $370.03 | $249.83 | Highest income ceiling. Pricing power still climbing. |
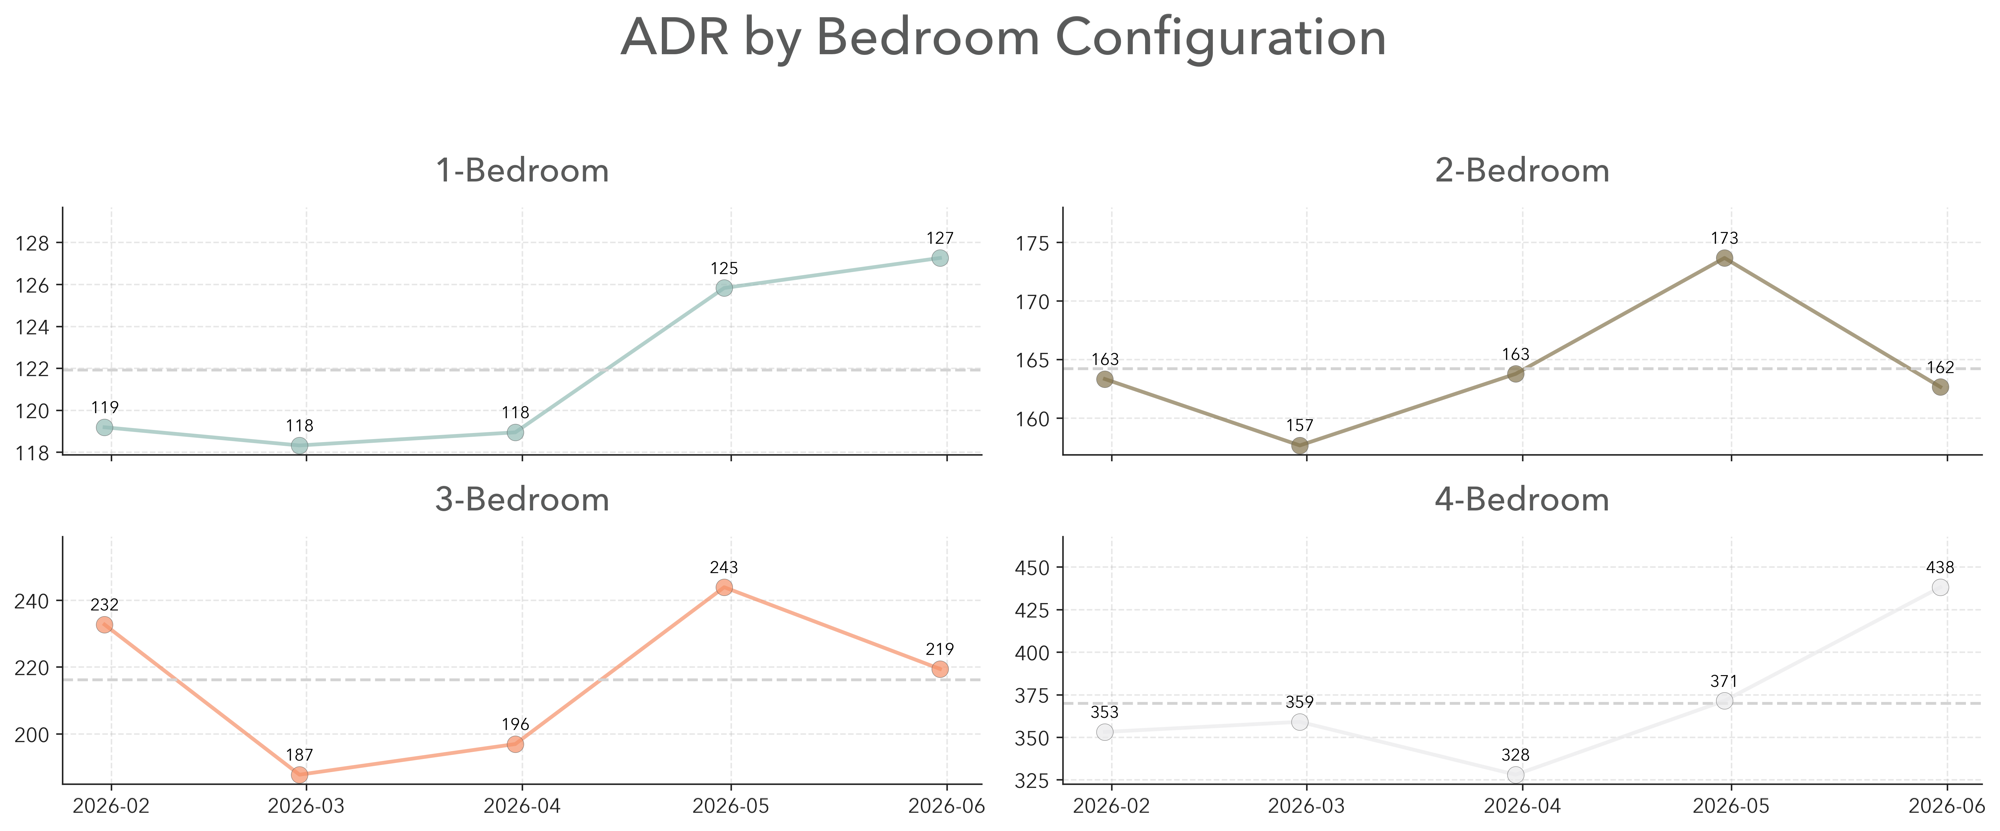 Figure 5. Our ADR by bedroom configuration, Jan-May 2026.
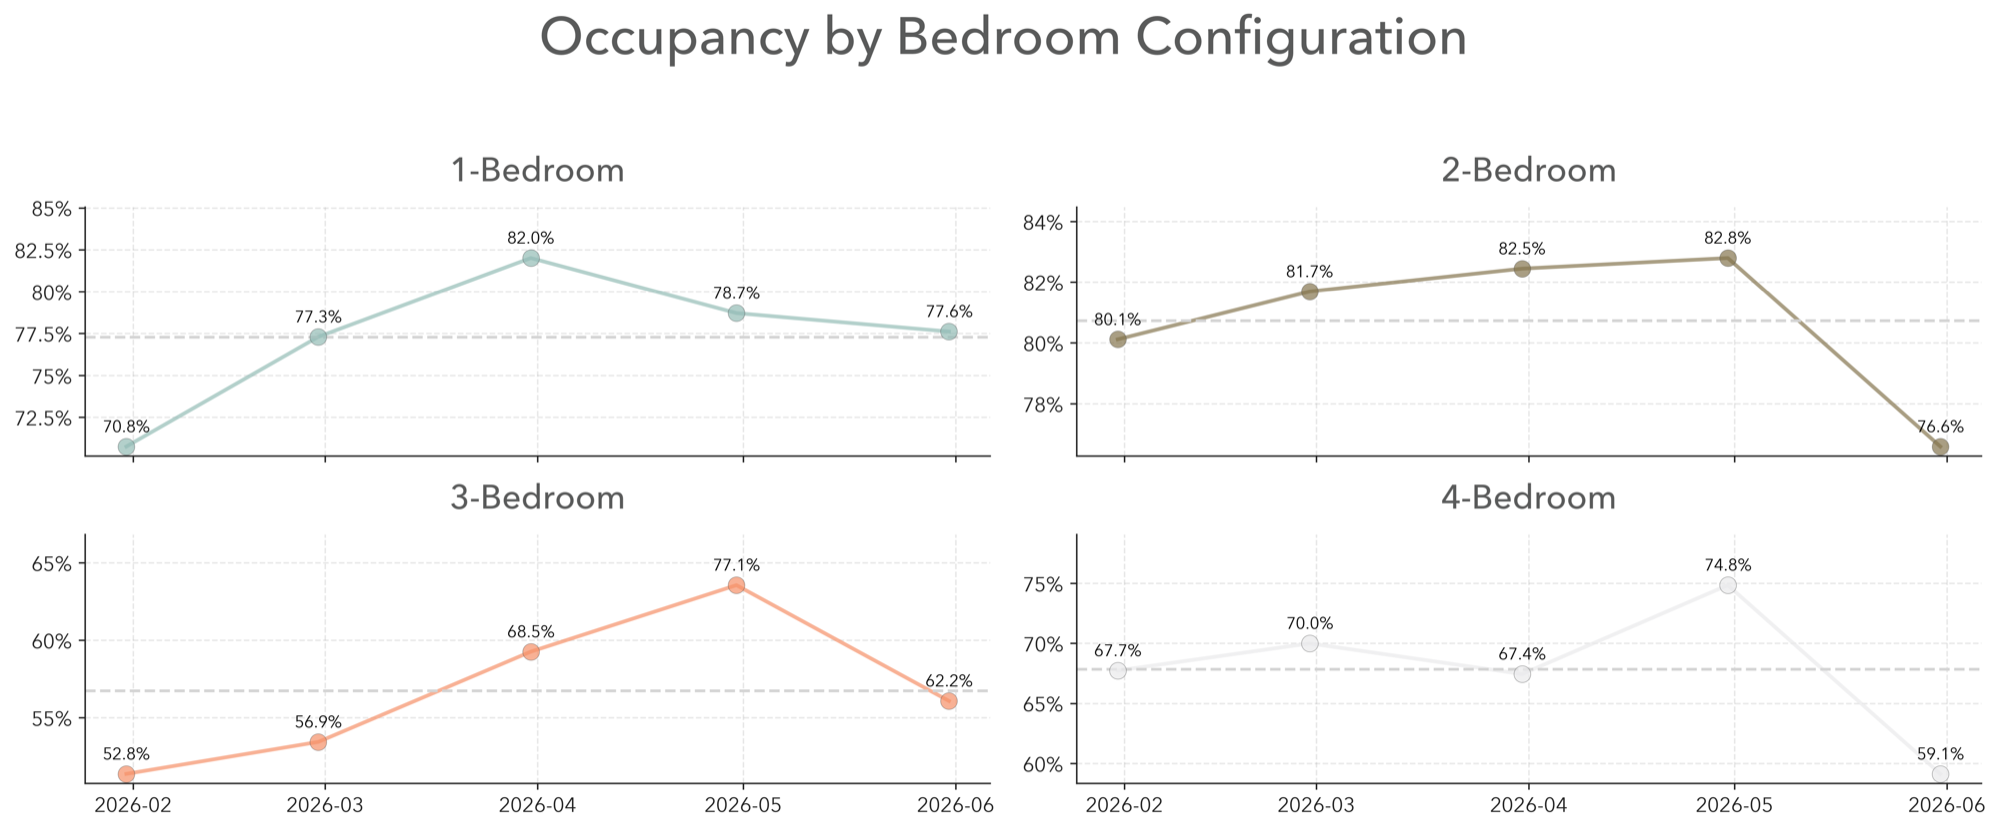 Figure 6. Our occupancy by bedroom configuration, Jan-May 2026.
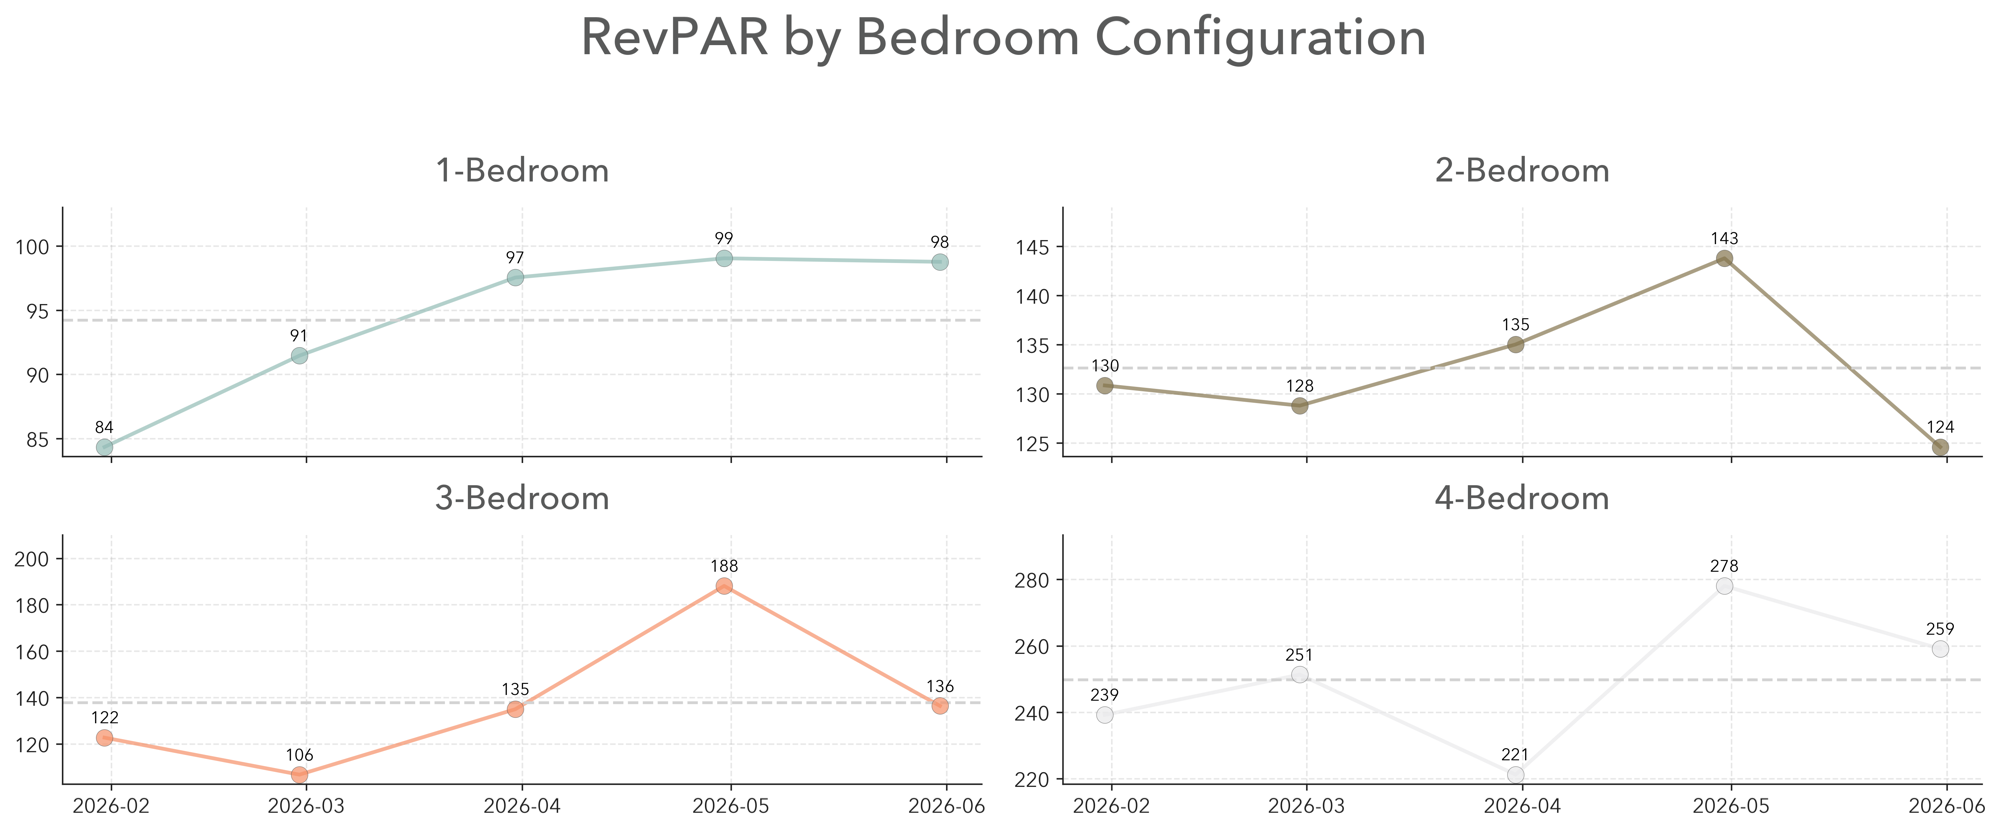 Figure 7. Our RevPAR by bedroom configuration, Jan-May 2026.
ADR scales cleanly with size - bigger units charge more, no surprise (Figure 5). Occupancy does not (Figure 6). The 2-bedroom panel sits at the top at 80.7%, and the 3-bedroom is the visible laggard at 63.5%, a 17-point utilization gap inside the same portfolio, in the same city, in the same five months. RevPAR (Figure 7) multiplies the two: the 4-bedroom wins the absolute level because its ADR overwhelms its softer occupancy, and - worth noting - the latest 4-bedroom monthly ADR reached $438 in May, well above its $370 H1 average. That’s not noise to discount against - the ceiling on four-bedroom rate hasn’t been found yet.
Two-bedrooms are doing the work of flexible lodging - leisure, business, relocation, small family, all in one calendar. Three-bedrooms aren’t. They hold a high ADR ($216) but can’t keep the calendar full, which is the classic sign of a configuration stuck between flexible-lodging utility and family-vacation pricing power, owning neither cleanly. The 3-bed earns its keep on rate today. The repositioning question - longer minimum stays, corporate and relocation targeting - is now two quarters overdue.
Market vs Portfolio
Here is the comparison that frames every acquisition decision: our portfolio by bedroom configuration against the Atlanta metro benchmark, averaged across Jan-May 2026.
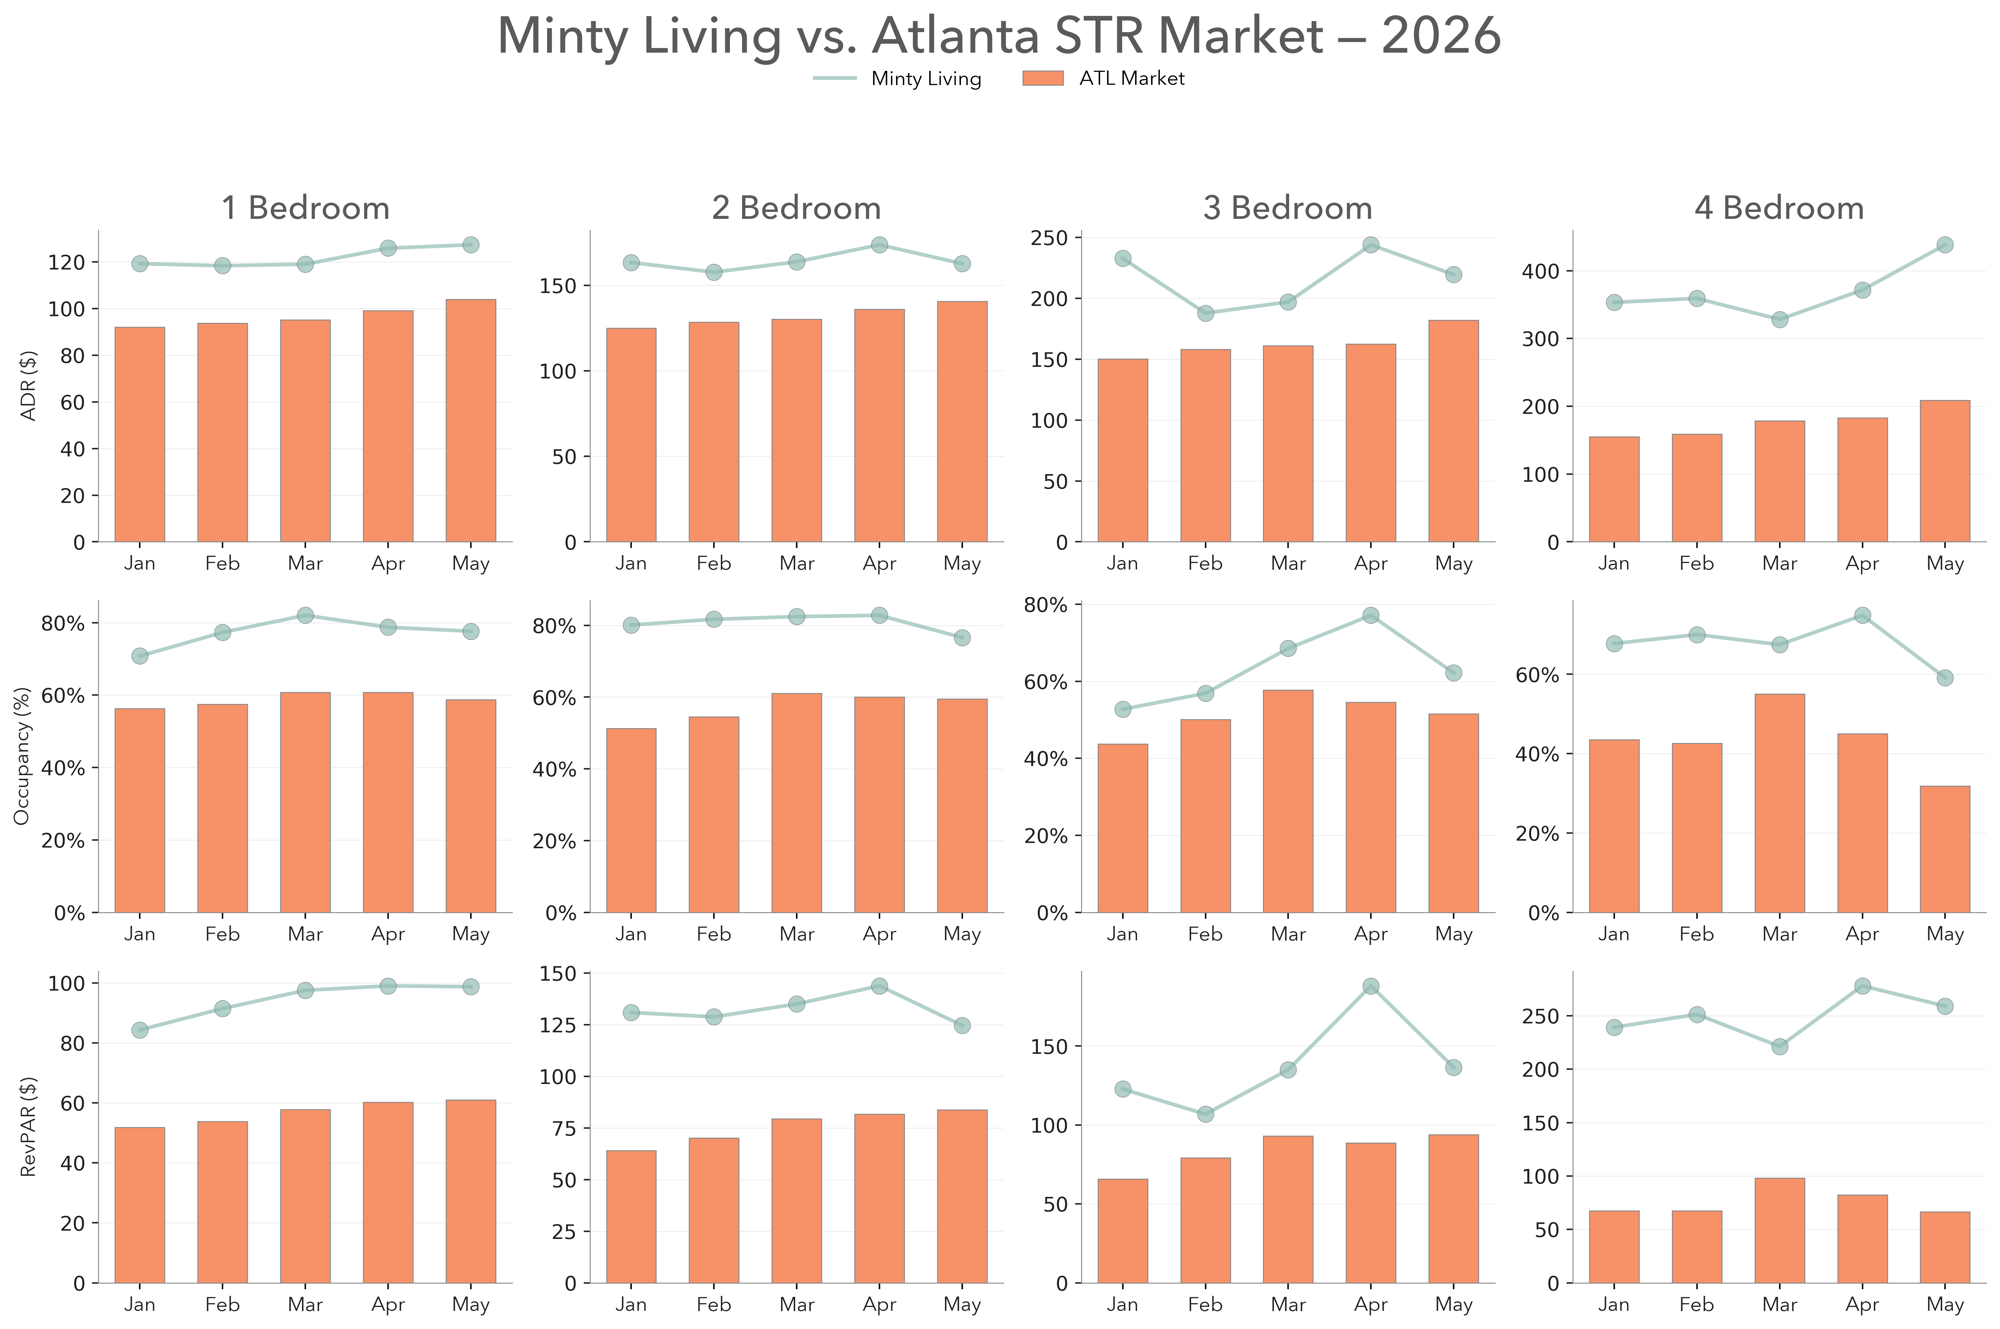 Figure 8. Our portfolio vs Atlanta market benchmarks, H1 2026.
| Segment | Minty RevPAR | Market RevPAR | RevPAR Lift | Minty Occ | Market Occ | Occ Gap |
|---|---|---|---|---|---|---|
| 1-bedroom | $94.25 | $56.94 | +65.5% | 77.3% | 58.8% | +18.5pt |
| 2-bedroom | $132.63 | $75.84 | +74.9% | 80.7% | 57.3% | +23.4pt |
| 3-bedroom | $137.86 | $84.06 | +64.0% | 63.5% | 51.5% | +12.0pt |
| 4-bedroom | $249.83 | $76.37 | +227.2% | 67.8% | 43.6% | +24.2pt |
| Portfolio | $153.64 | $61.60 | +149.4% | 72.3% | 58.2% | +14.1pt |
Two reads. First, we cleared the metro RevPAR benchmark in all four configurations, and in three of four the lift is 65% or more. That is not market beta - the Atlanta metro occupancy floor is mid-50s and we run mid-70s; the gap is selection (submarket, property quality) and operation (pricing posture, channel mix), not a rising tide. Second, the spread is widest exactly where you’d want capital concentrated: the 4-bedroom (+227%) and the 2-bedroom (+75%).
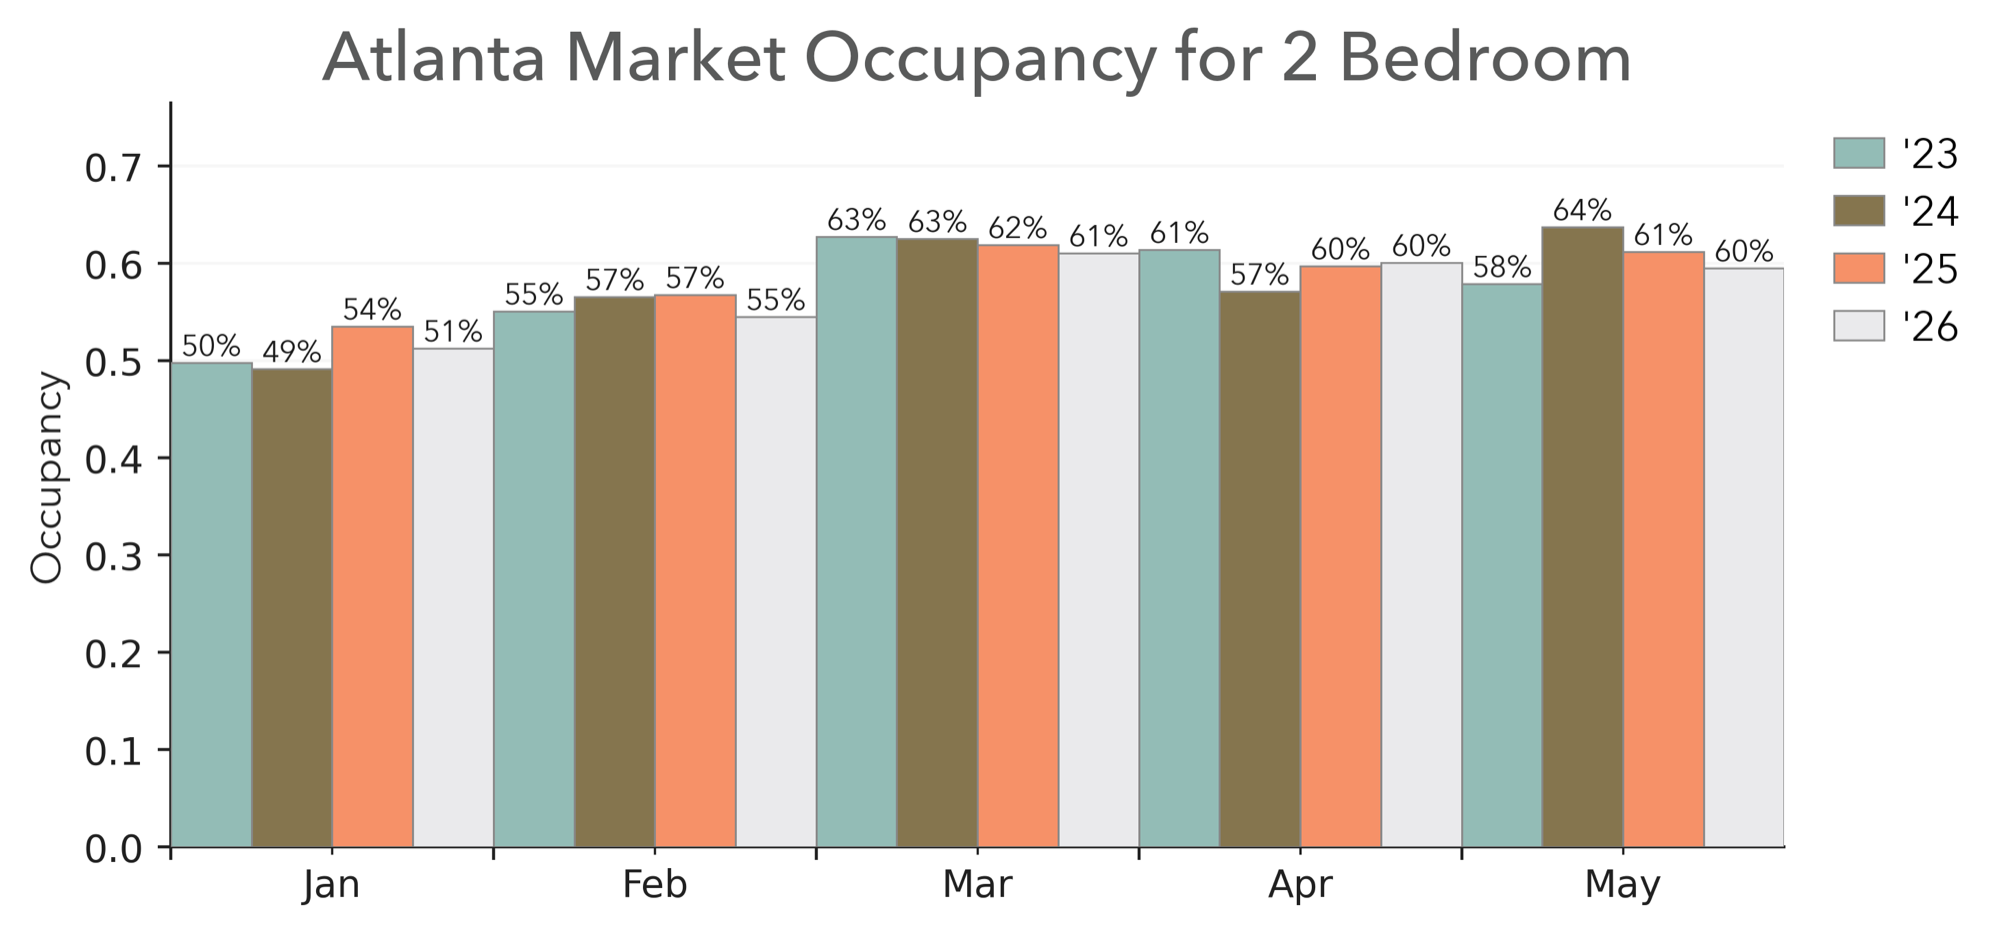 Figure 9. Atlanta 2-bedroom market occupancy by month, full metro. AirDNA.
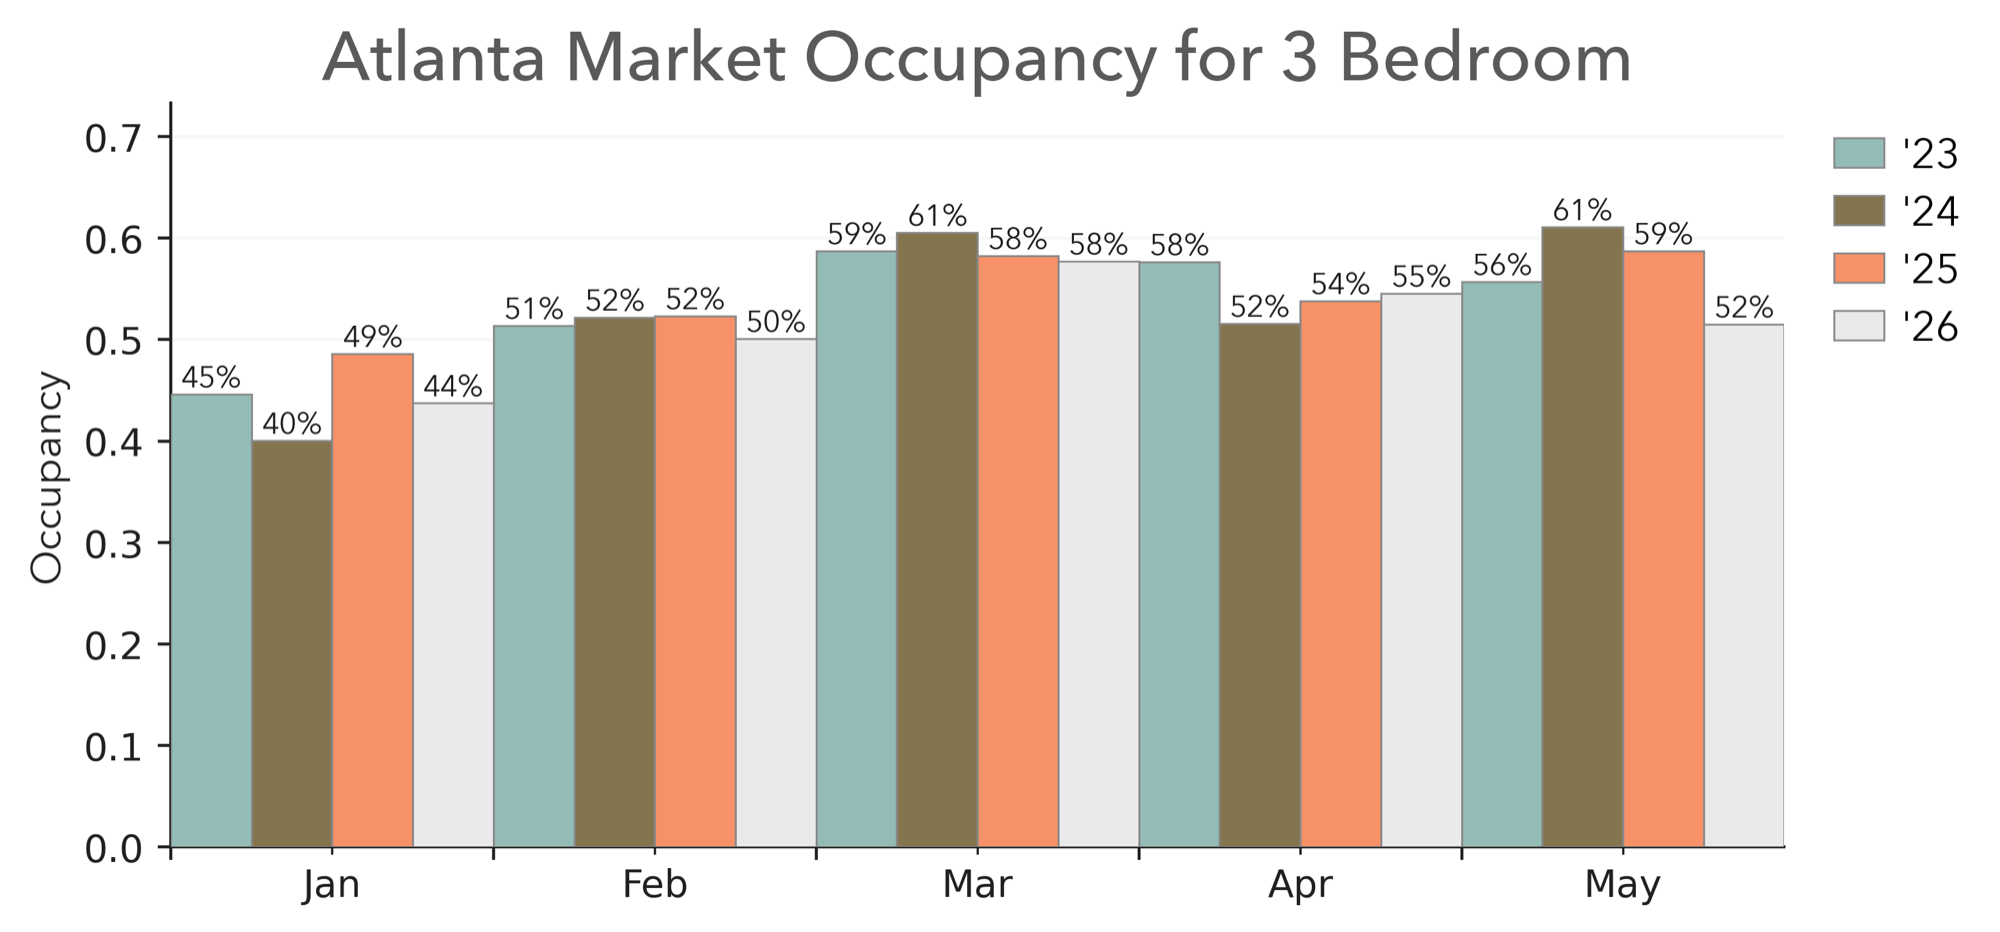 Figure 10. Atlanta 3-bedroom market occupancy by month, full metro. AirDNA.
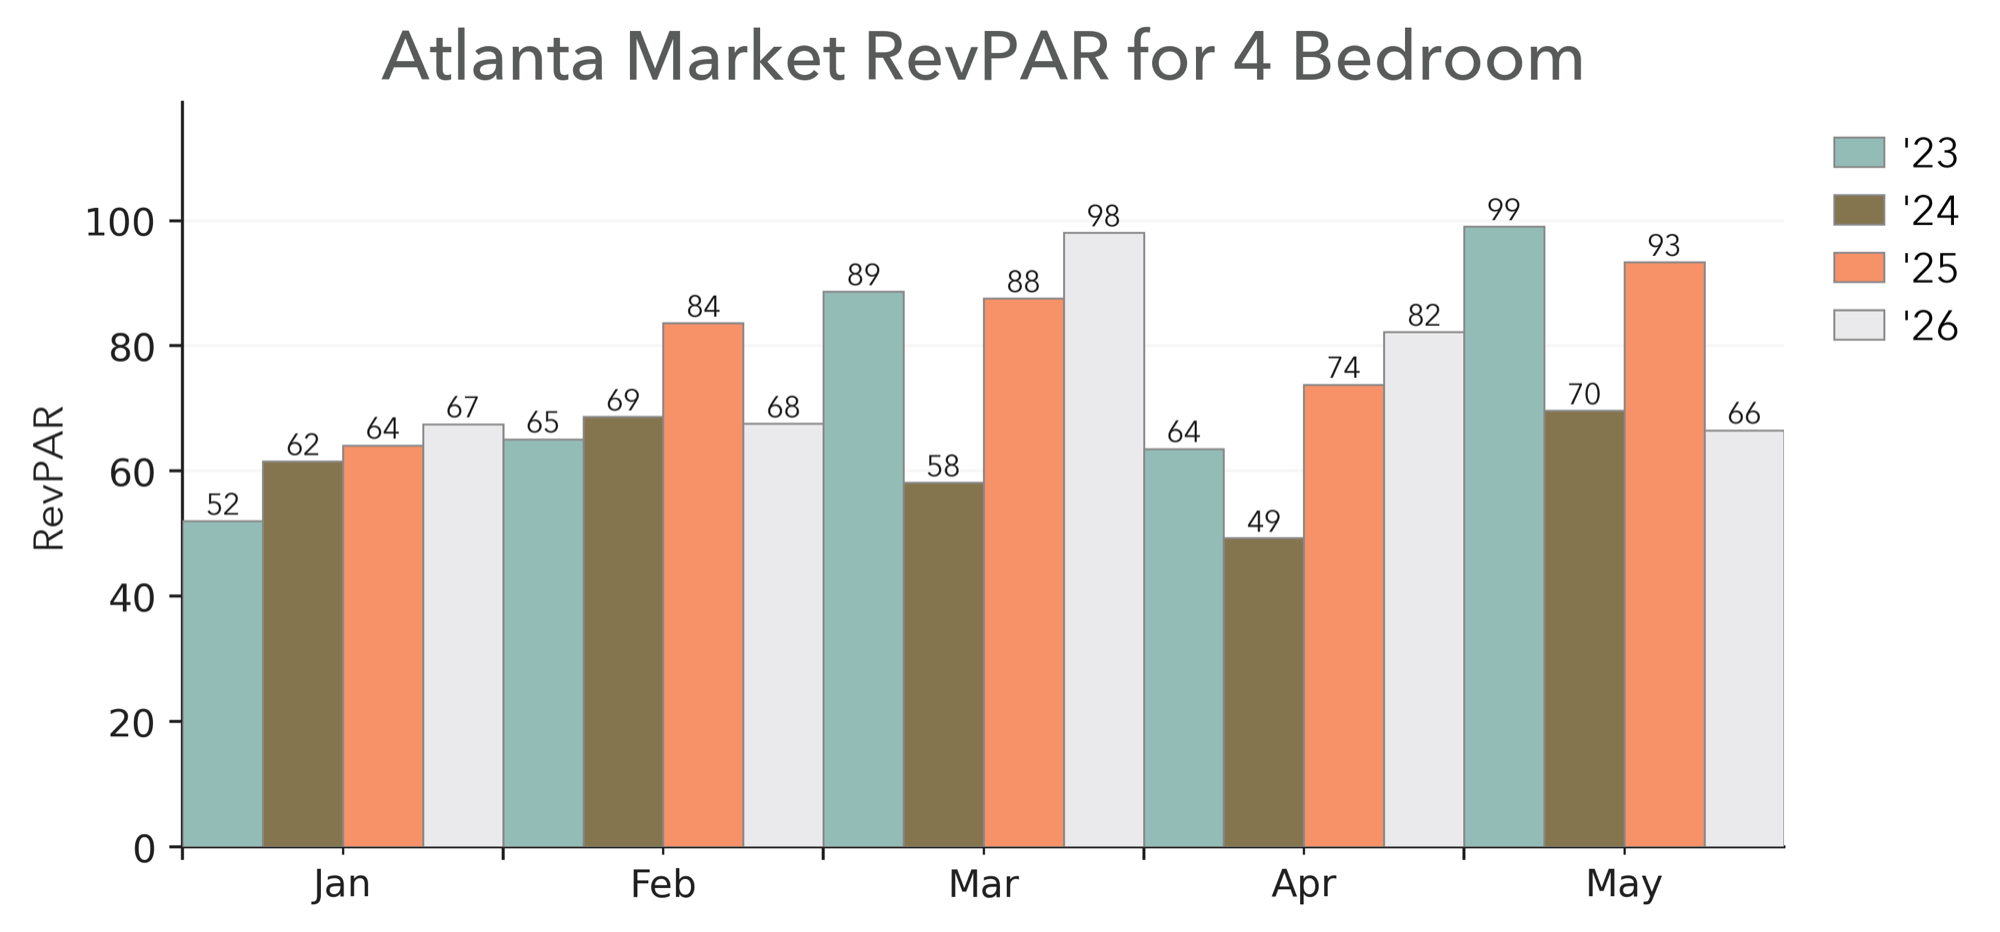 Figure 11. Atlanta 4-bedroom market RevPAR by month, full metro. AirDNA.
The 3-bedroom segment deserves the caveat it earned last quarter: its softness is partly market-wide, not specific to us. Metro 3-bed occupancy sits in the low 50s (Figure 10), so our 63.5% still clears the market - we’re just clearing a low bar. The 4-bedroom comparison (Figure 11) carries the opposite caveat: the metro 4-bed sample is thin (roughly 19 active listings in May), so treat the eye-watering +227% lift as directionally true but statistically noisy. The 2-bedroom story needs no asterisk - deep market sample, wide and durable spread.
A data note for the reader. This issue benchmarks against the full Atlanta-metro AirDNA panel (~12,600 listings, ~$106 all-bedroom ADR). Our Q1 2026 issue used a narrower intown comp set (~820 listings, ~$170 ADR). The two are not directly comparable: against the broader, lower metro benchmark, the same portfolio shows a much larger outperformance than the Q1 figures implied. We’re standardizing on the full-metro panel going forward because it is the honest denominator for “how does this market actually pay,” but read any quarter-over-quarter market delta with that change in mind.
Channel Mix: Dashboard vs Calendar
Airbnb sent us 1,008 bookings in H1. Direct sent 115 - about one-ninth the count. Yet direct produced nearly as many booked nights as Airbnb did. Airbnb wins the dashboard. Direct wins the calendar.
| Channel | Bookings | % | Avg Stay | Direction |
|---|---|---|---|---|
| Airbnb | 1,008 | 66.3% | 7.4 nights | Volume engine. |
| VRBO | 150 | 9.9% | 5.0 nights | Family/leisure supplement. |
| Direct | 115 | 7.6% | 59.8 nights | Corporate housing in disguise. |
| Website | 103 | 6.8% | 7.3 nights | Owned-demand expansion. |
| Booking.com | 61 | 4.0% | 5.5 nights | International supplemental. |
| Other | 84 | 5.5% | mixed | Owner, Marriott, corporate. |
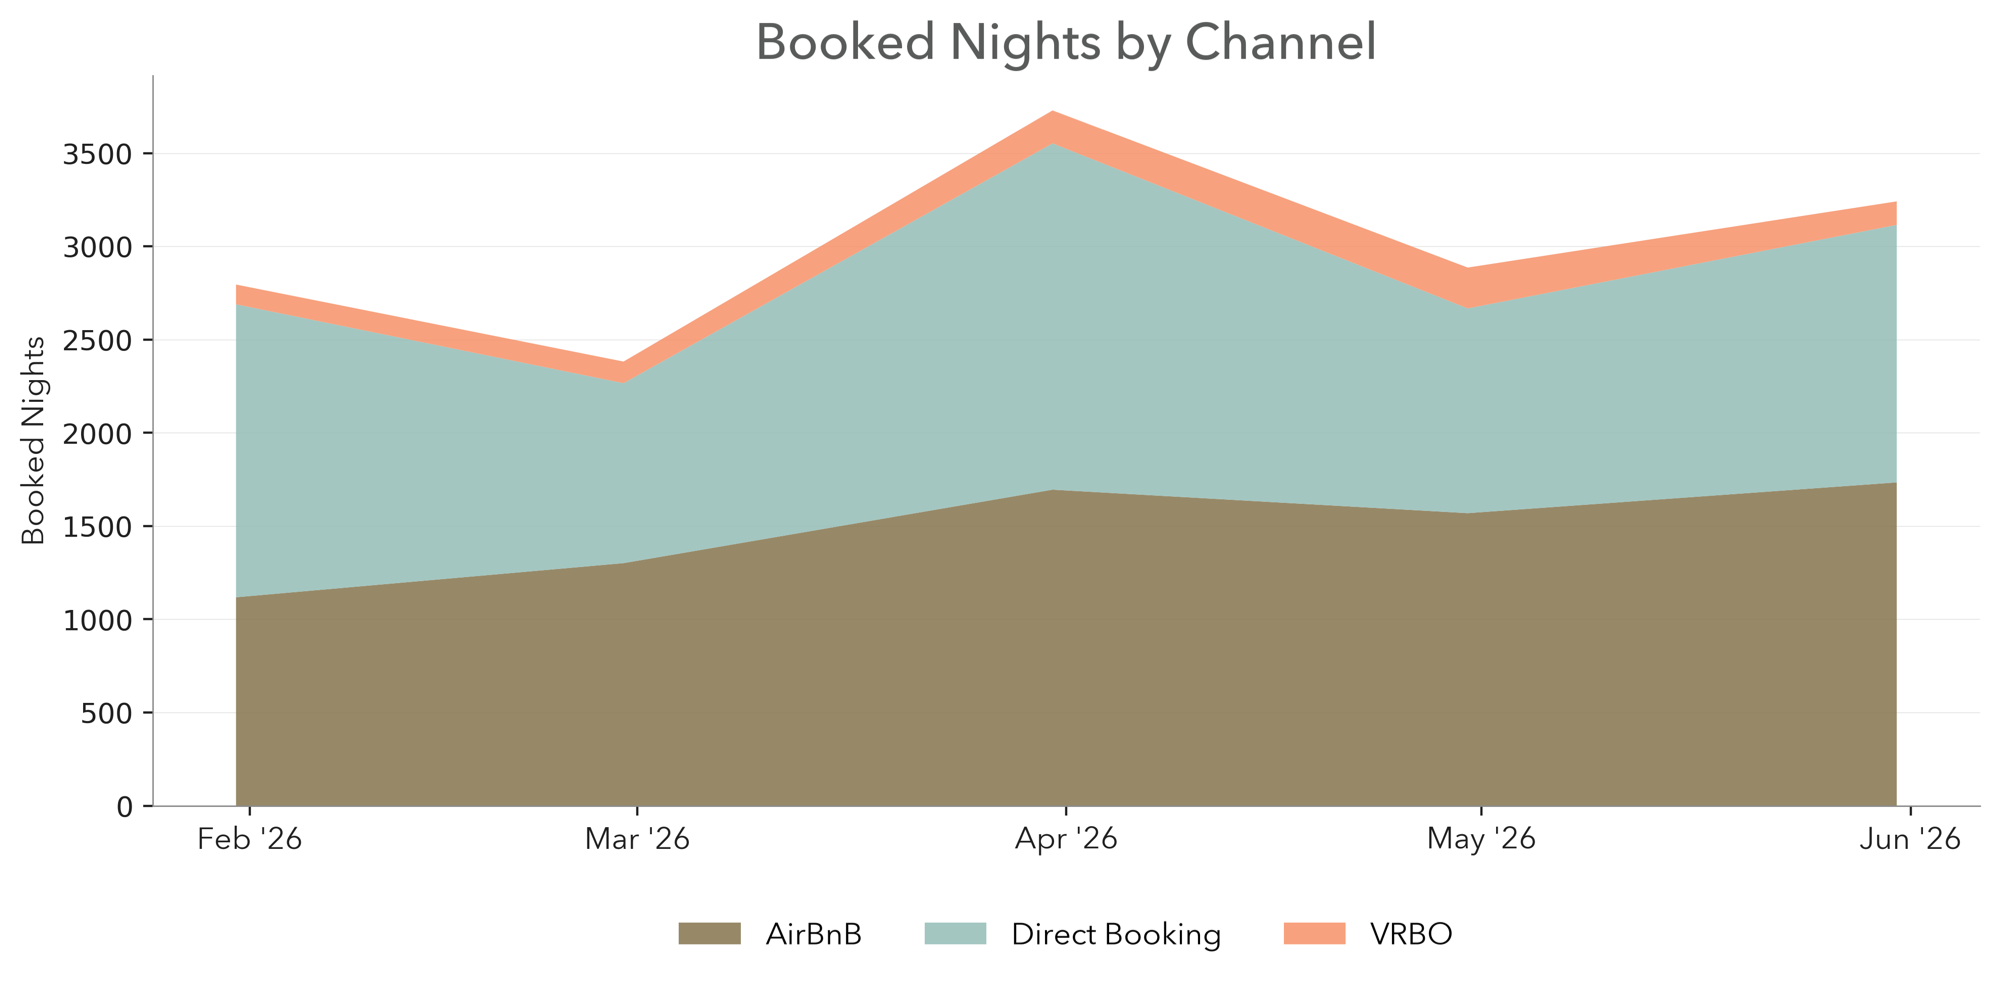 Figure 12. Our booked nights by channel, H1 2026.
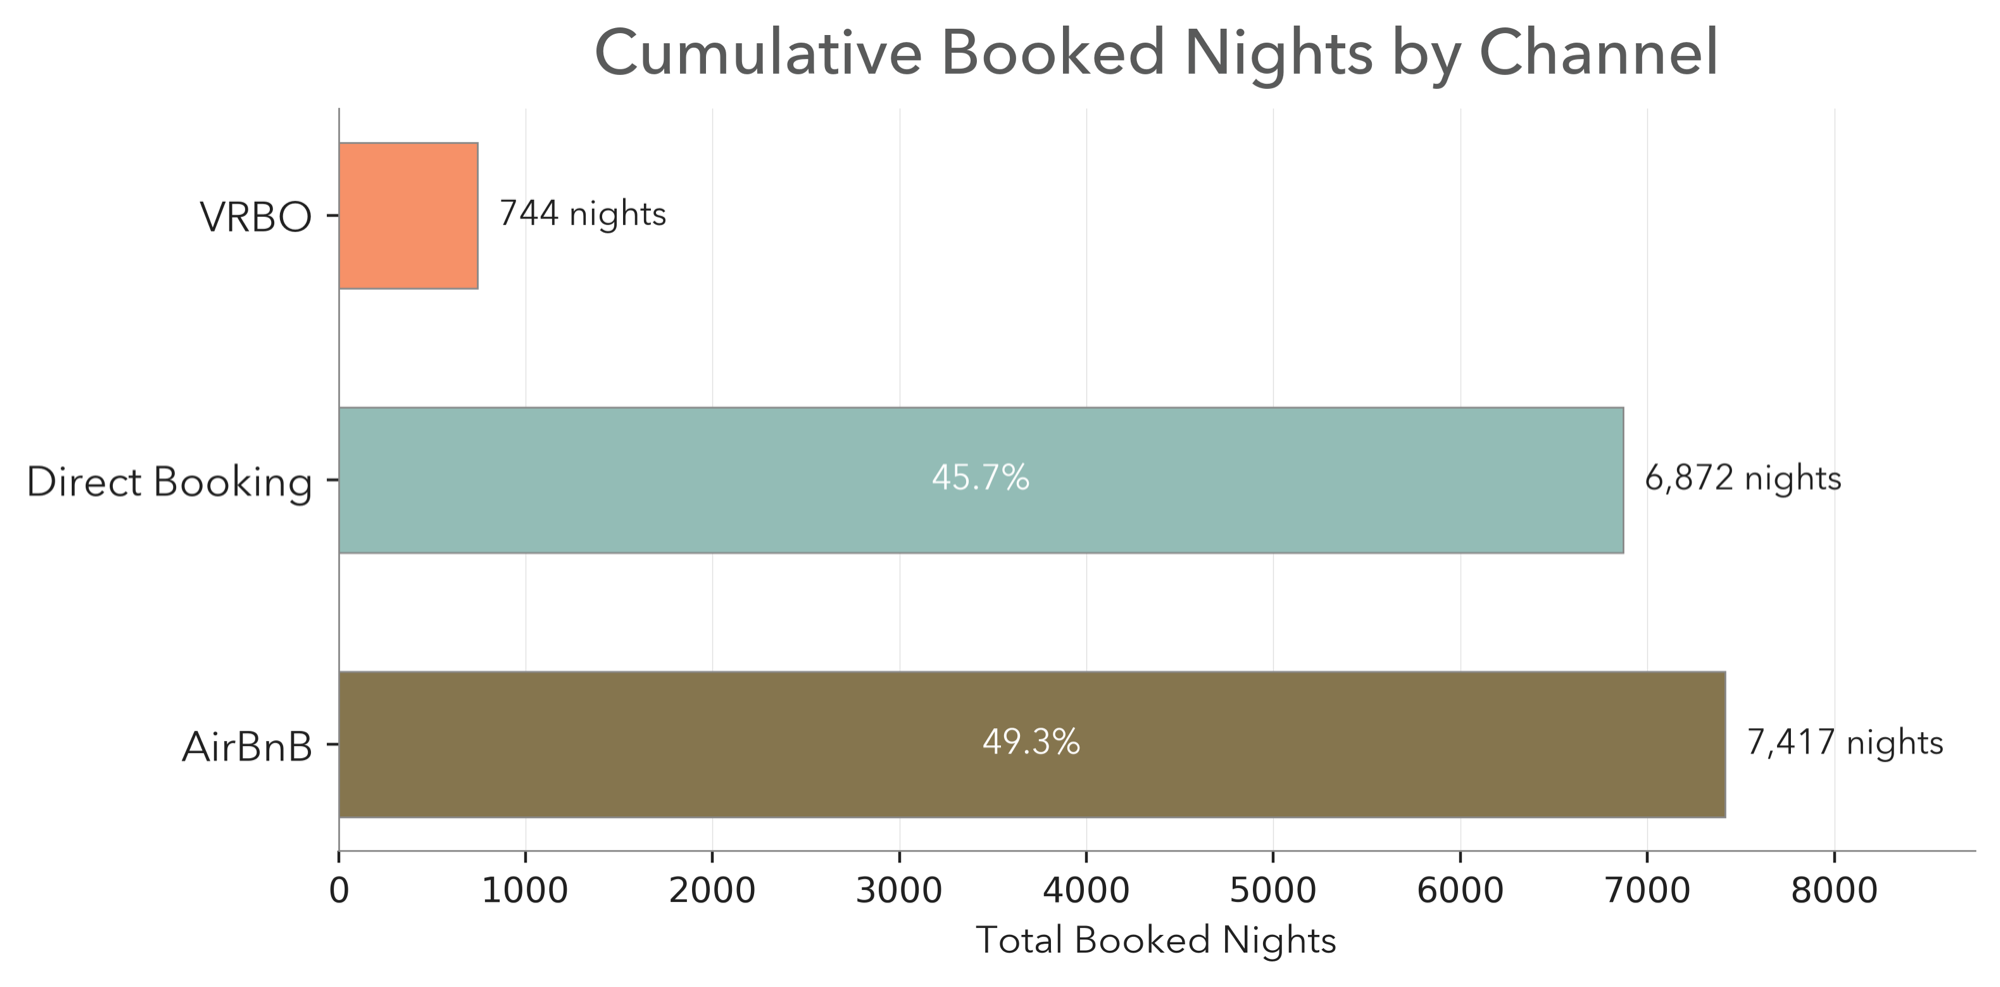 Figure 13. Our cumulative booked nights by channel, H1 2026.
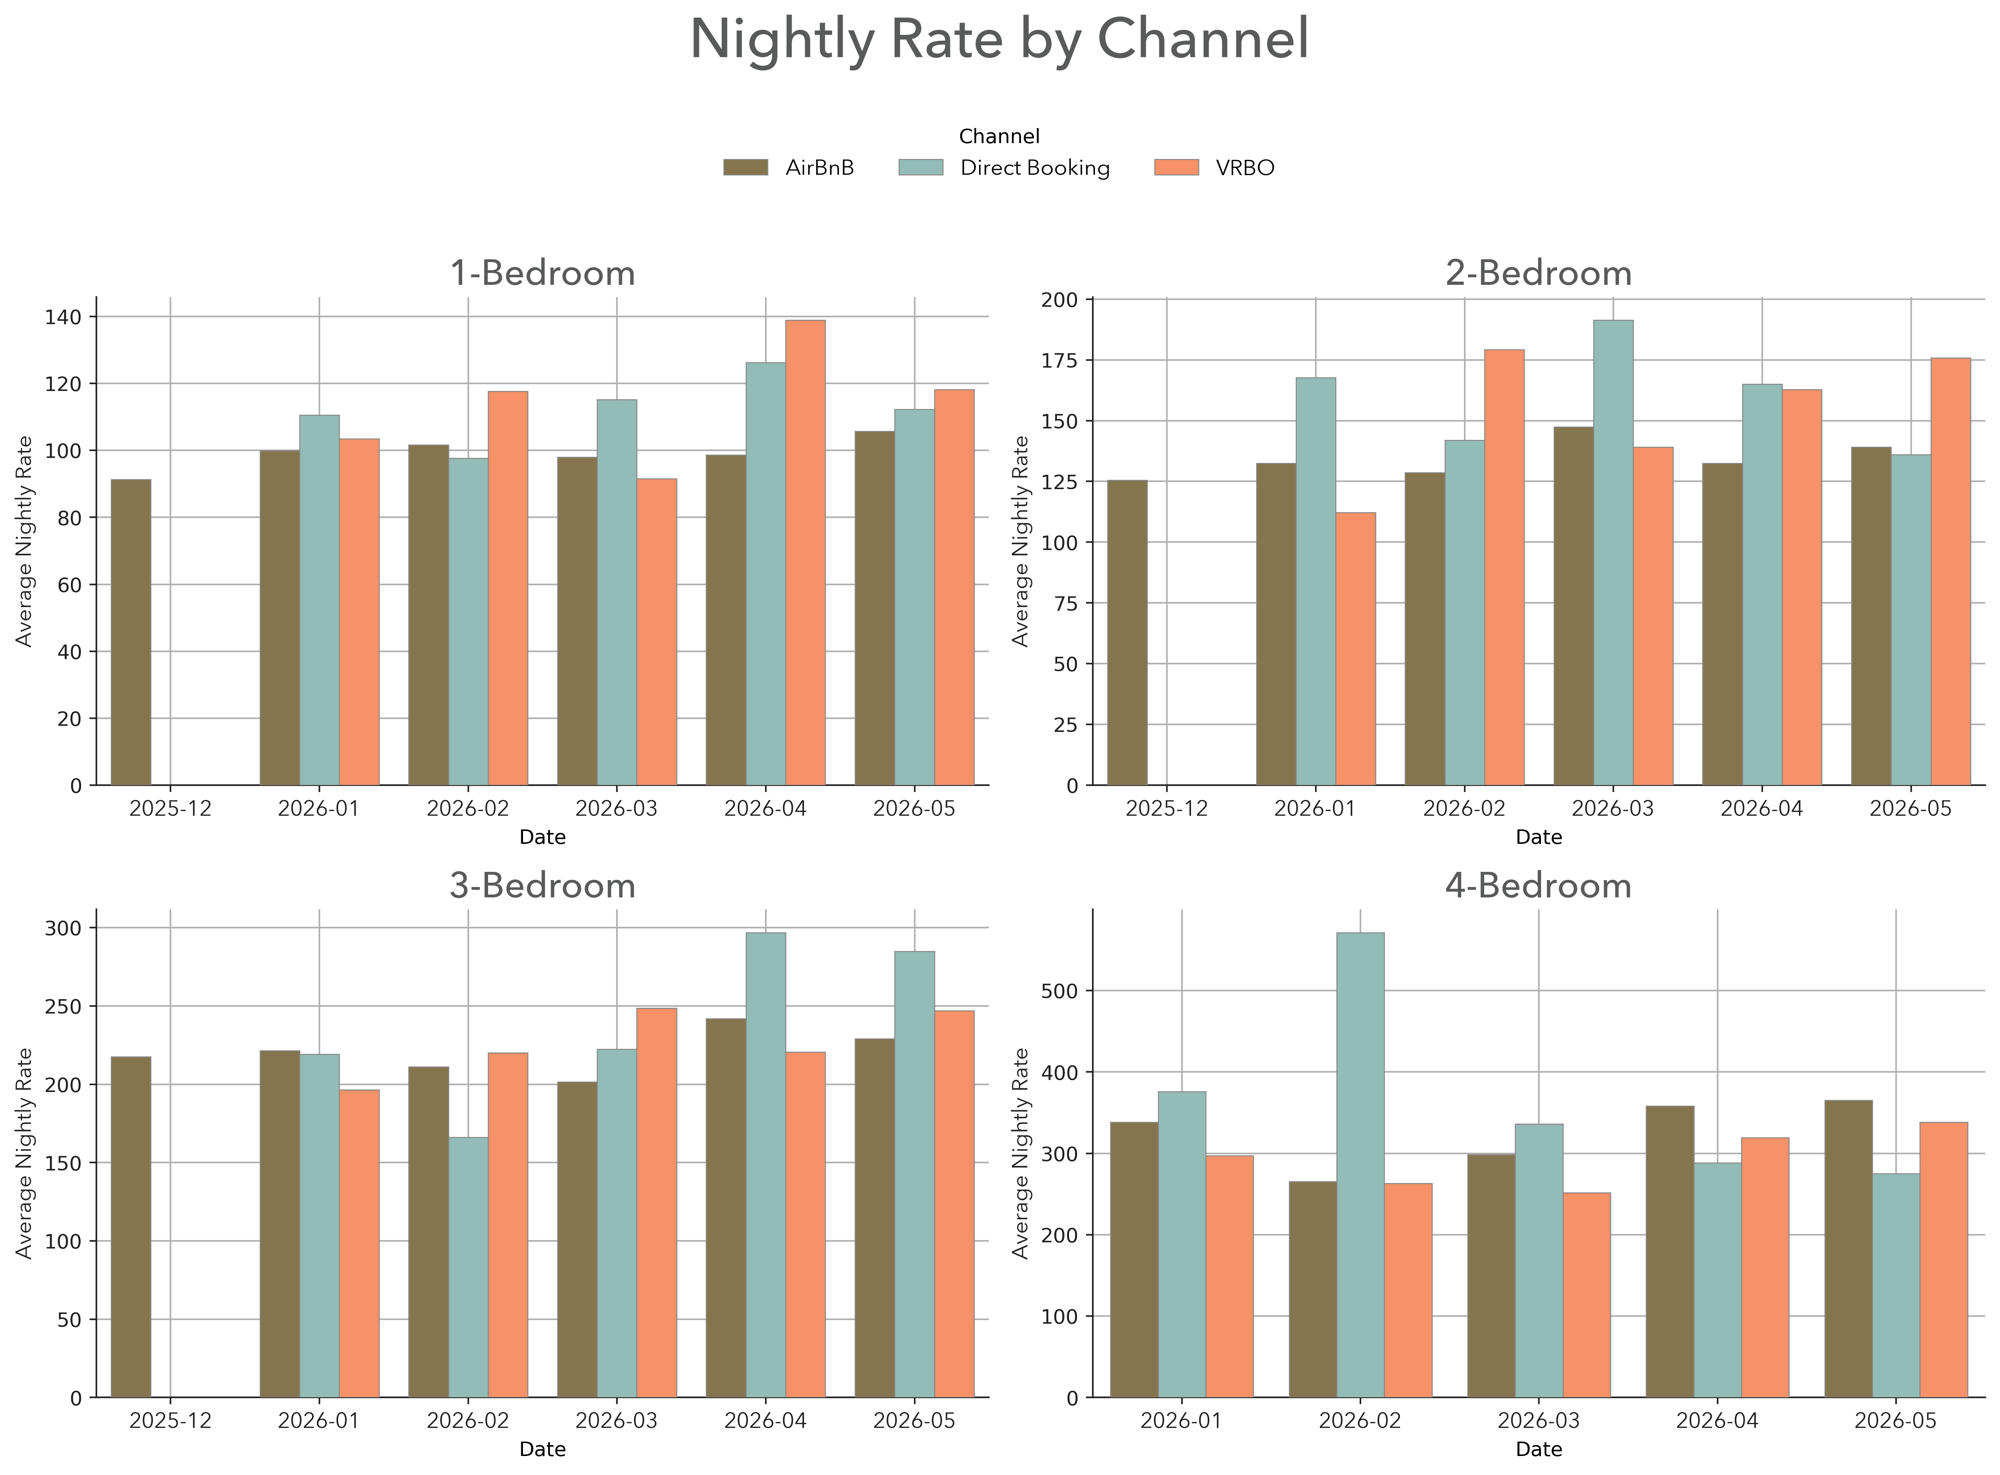 Figure 14. Our nightly rate by channel, H1 2026.
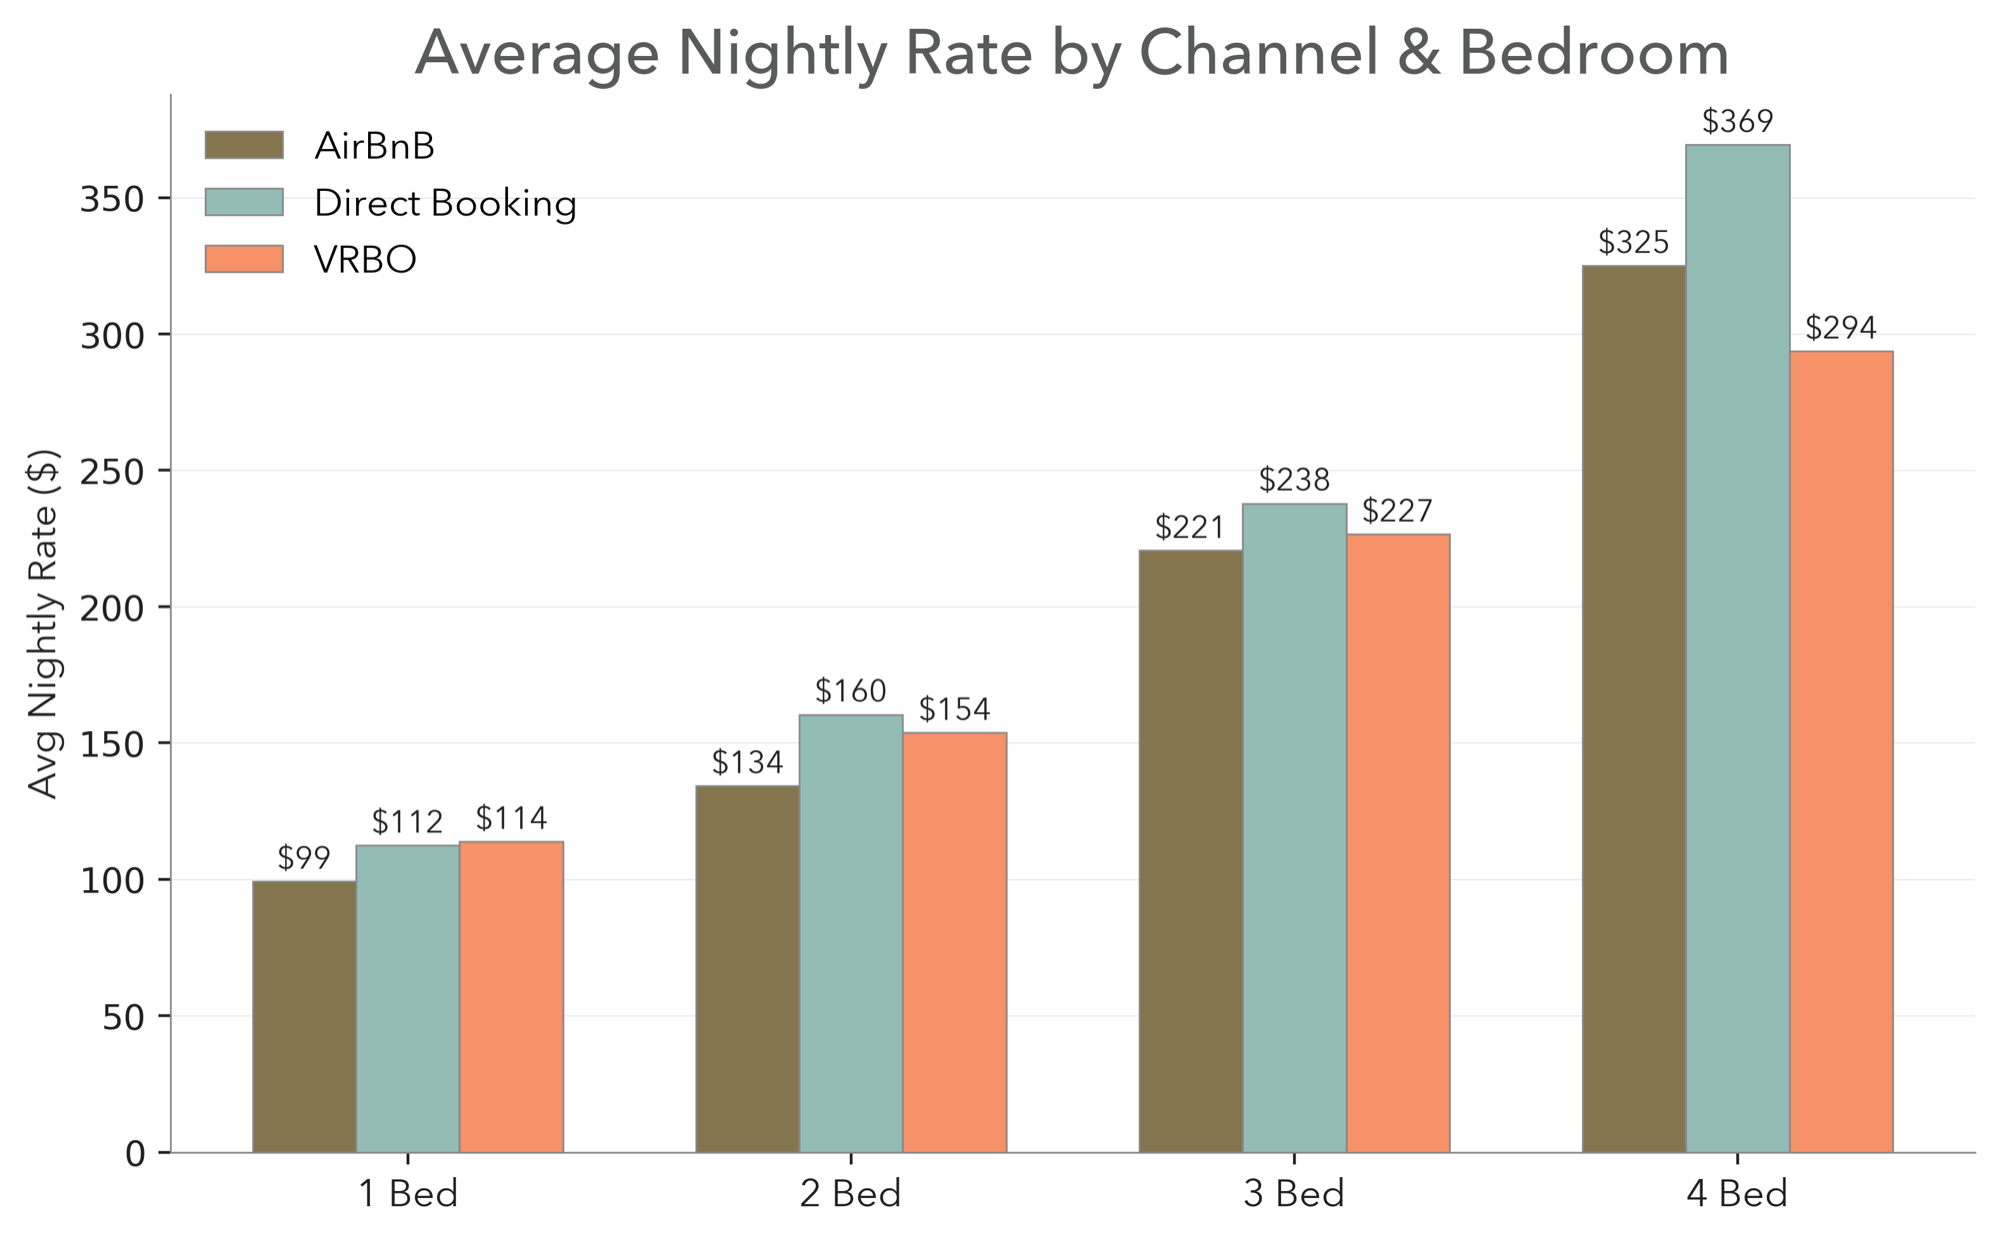 Figure 15. Our ADR by channel summary, H1 2026.
Run the arithmetic. Airbnb’s 1,008 bookings at 7.4 nights is roughly 7,460 booked nights. Direct’s 115 bookings at 59.8 nights is roughly 6,880 - about 92% of Airbnb’s calendar, from one-ninth the booking count. One direct booking equals roughly eight Airbnb stays in nights consumed, and it does so at a nightly rate that clears Airbnb in the larger configurations (Figures 14-15) - before subtracting the marketplace commission, which runs anywhere from 3% to 15% depending on the split.
A 60-night direct booking is not a vacation rental. It is furnished-housing demand sitting inside the same calendar as weekend leisure. Most owners, and most pricing engines, still treat those two demand types as one number. They are not.
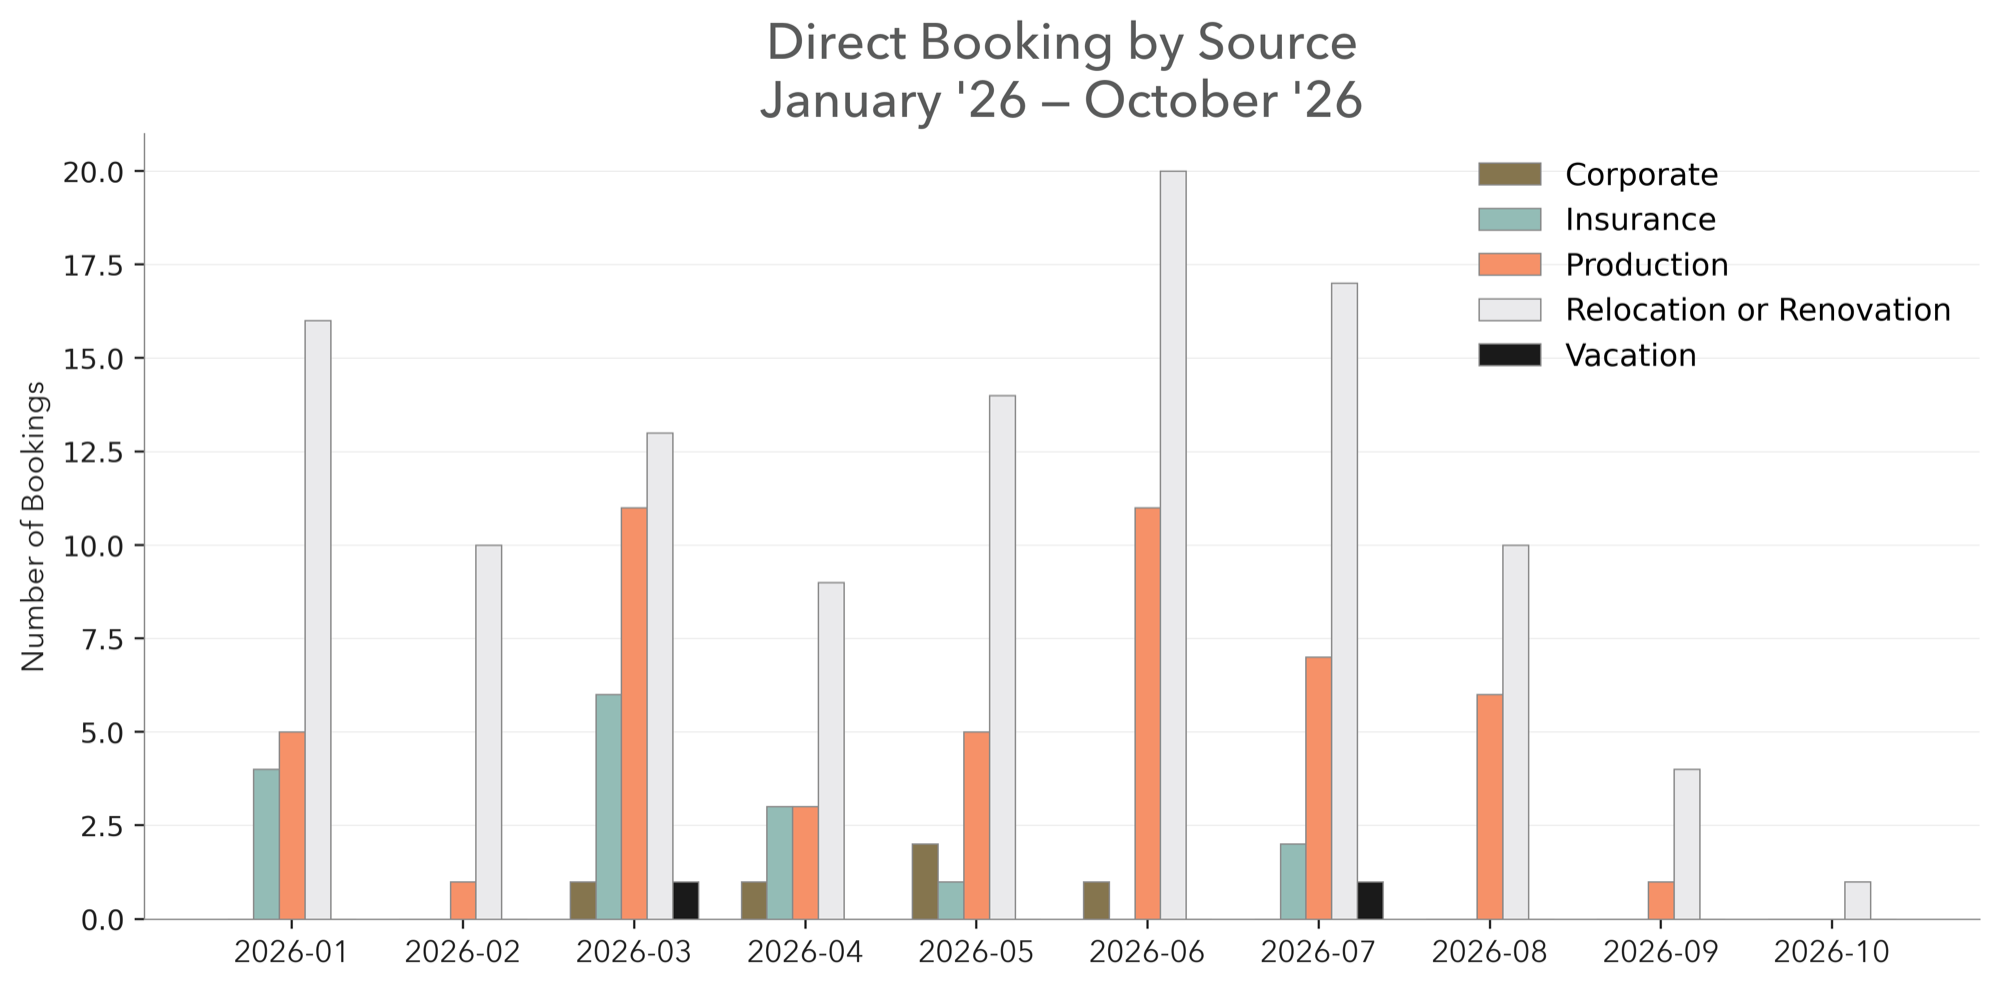 Figure 16. Direct booking lead sources, 2026 YTD (ClickUp Guest Inbound).
The direct-booking source breakdown (Figure 16) is where this becomes actionable: it shows which lead types - corporate, insurance, production, relocation - are actually filling those long-stay calendars, which is exactly where marketing dollars and owner-services outreach earn their highest return.
Booking Pace
H1 average lead time was 18.9 days. The breakdown matters more than the headline:
| Stay Length | Avg Lead Time | Read |
|---|---|---|
| 0-2 nights | 13.4 days | Last-minute weekends and business trips. |
| 3-7 nights | 22.9 days | Normal leisure planning window. |
| 8-29 nights | 18.5 days | Extended stays, booked a few weeks out. |
| 30-199 nights | 23.8 days | Long-stay and corporate demand. The good kind. |
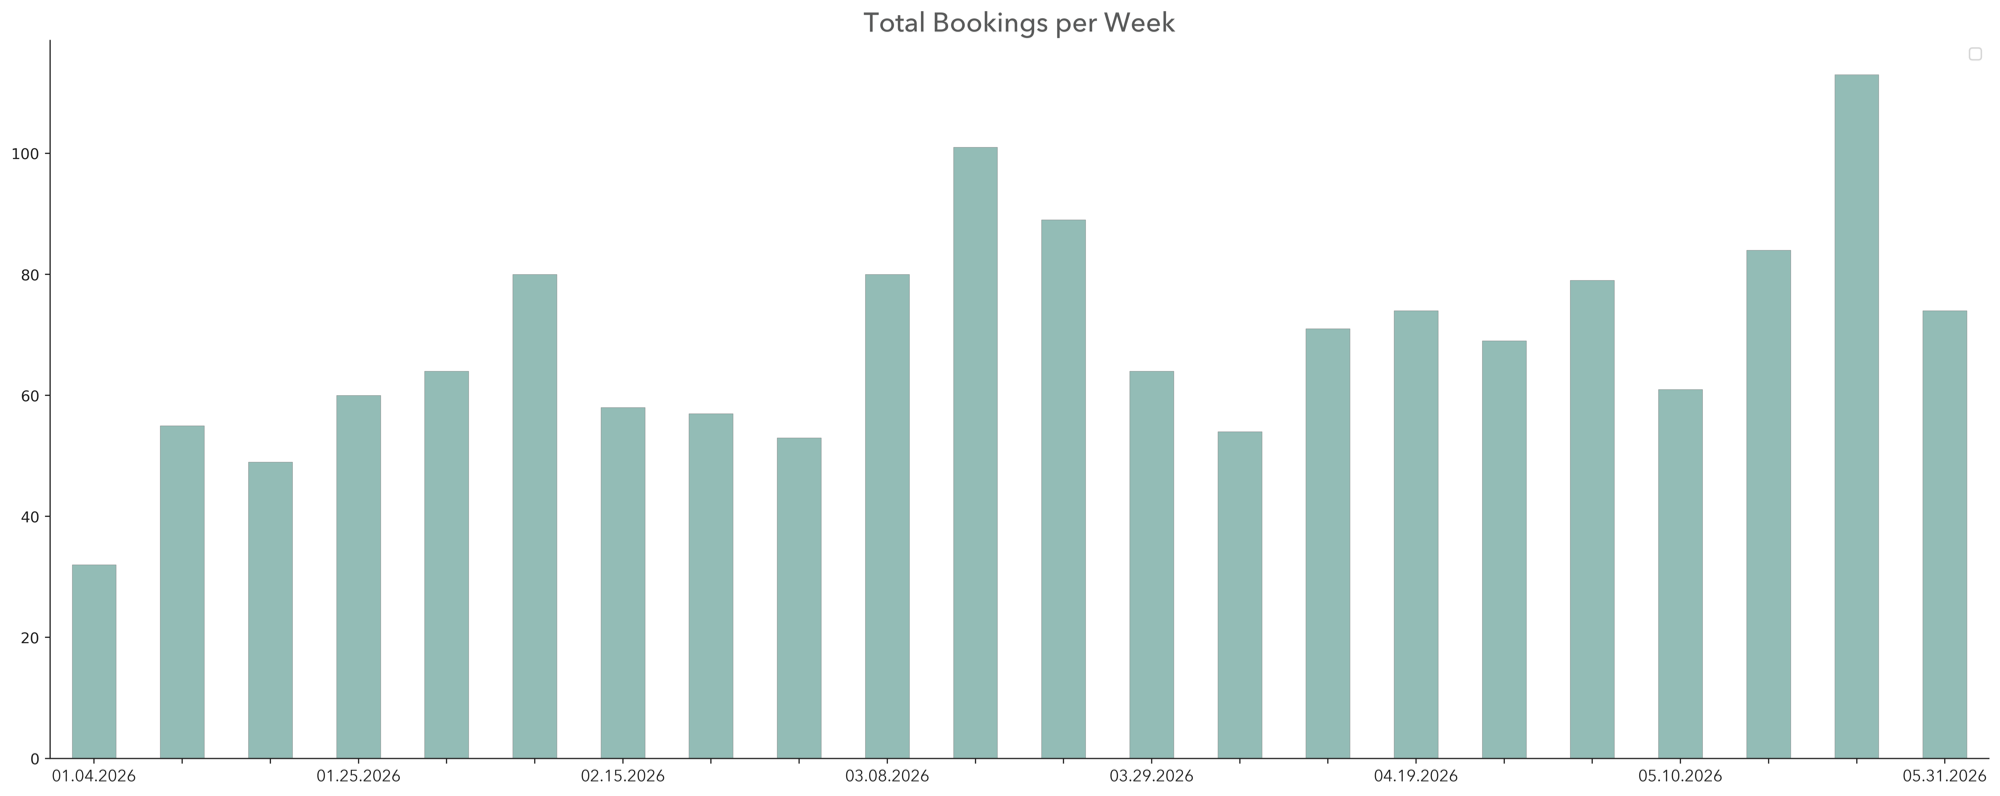 Figure 17. Our weekly booking count, H1 2026.
Two numbers carry this section. 76% of bookings run under 7 nights - the leisure core that pays the rent. But 23% run 8 nights or longer, and that quarter of the calendar is what smooths revenue and cuts the cleaning-and-turnover bill. Lead times stay under three weeks across every band, even month-plus stays: Atlanta guests book close-in and expect to find space. You price this market a few weeks out, not months ahead.
Underwriting Frame
A back-of-envelope for a 2-bedroom Atlanta acquisition at our H1 economics - deliberately conservative against the portfolio’s actual 80.7% / $164:
| Line | Value |
|---|---|
| ADR | $160 |
| Occupancy | 78% |
| RevPAR | $125 |
| Annual GRR (per unit) | $45,625 |
| Operating expense ratio | ~35% |
| Net Operating Income | ~$29,656 |
| All-in basis $400K | Cap rate ~7.4% |
| All-in basis $325K | Cap rate ~9.1% |
This is the napkin, not the model. Real underwriting needs neighborhood comps, taxes, insurance, financing, permitting, and capex reserves. But two distinctions decide the deal. Cap rate is unleveraged. Cash-on-cash is what your equity earns after debt service - with 25% down at a 7% mortgage, the $325K case runs low-double-digit cash-on-cash, the $400K case closer to 7%. And sensitivity beats the headline: drop occupancy from 78% to 68% and the $400K case falls toward a sub-6% cap. The market average occupancy is 58%. The entire investment case rests on operating above it - which is the thesis of this whole report.
H2 Outlook + Verdict
| Signal | Read |
|---|---|
| Market RevPAR $55→$67 across the half | Seasonal tailwind into summer. |
| 2-bed utilization 80.7%, +23pt vs market | Continue accumulating. |
| 4-bed May ADR $438 (above H1 avg) | Hold/raise rate; don’t discount. |
| 3-bed occupancy 63.5%, two quarters soft | Reposition to long-stay, or trim. |
| Direct = 92% of Airbnb’s booked nights | Build for it; staff and price for it. |
H1 2026 Atlanta STR investability: B+ / Overweight 2-bed and 4-bed; fix or exit 3-bed.
Atlanta is large, liquid, and competitive - attractive when you have an operating edge, dangerous when you don’t. The metro average earns $62 a night. The data does not support buying any Atlanta property and assuming demand solves the underwriting; it supports buying the right configuration, in the right submarket, with direct-demand capability - and then operating it well enough to live in the top quartile, where the actual money is.
How Minty Living Can Help
Everything in this report points to one conclusion: in Atlanta, the market average is not your competition - operating above it is the whole investment case. The distance between the metro’s $62 RevPAR and a top-quartile number isn’t luck or a rising tide. It’s design, pricing discipline, channel mix, and the daily work of running a property well.
That distance is exactly what we build. Minty Living manages 160+ professionally designed properties across Atlanta’s best intown neighborhoods, and across the same H1 2026 window covered here, our portfolio ran roughly 2.5x the metro RevPAR benchmark - clearing the market in every bedroom configuration. Here’s how:
Design that earns rate. Our in-house team, led by architect co-founder Sidra Gross, turns properties into spaces built to book - the reason our eligible portfolio meets Plum Guide’s “Top 1%” selection standard.
Data-driven revenue. We price and distribute across every channel using the same booking-level data behind this report, so your calendar captures both the leisure core and the long-stay, corporate, and relocation demand most operators leave on the table.
Full-service management. Design, photography, maintenance, guest communication, and revenue optimization - handled end to end, at a 4.9 Google rating and Airbnb Superhost standard.
If you own an Atlanta property - or you’re weighing one - and you want it managed to perform in the top quartile rather than the market average, we’re happy to cross-reference this report against your specific submarket and bedroom configuration and show you what professional management could do for your numbers. Even if you’re only exploring, the conversation is free.
Tell us about your property and we’ll reach out - fill out this quick form. You can also get a free property evaluation at owners.mintyliving.com or call (404) 999-0841.
Methodology and Disclosures
AirDNA Atlanta full-metro benchmark CSVs (Jul 2017 - May 2026, all bedroom configurations) plus our H1 2026 portfolio booking data (1,521 bookings, standard date filtering and IQR 1.5x outlier removal). ADR is booking-day-weighted; occupancy is booked days ÷ available days; RevPAR is ADR × occupancy. Per-segment figures are averaged across Jan-May 2026.
Period and benchmark notes. The window is Jan 1 - May 31, 2026; June is excluded because metro market data was not yet final at publication. The market benchmark is the full Atlanta metro AirDNA panel and differs from the narrower comp set used in the Q1 2026 issue (see the data note above) - market figures are not directly comparable across the two issues. The metro 4-bedroom sample is small and its comparison should be read as directional.
This is informational, not investment, legal, tax, or financial advice. Historical performance and current operating data do not guarantee future results. Any acquisition should be evaluated against purchase price, financing, taxes, insurance, HOA restrictions, permitting, operating expenses, and your own objectives.



 (4).png)

 (29).png)
 (28).png)
 (33).png)
 (37).png)
 (38).png)
 (39).png)
 (40).png)
 (44).png)
 (44).png)
 (1).png)
 (3).png)
 (55).png)
 (54).png)
 (56).png)
 (57).png)
 (58).png)
 (59).png)
 (60).png)
 (61).png)
 (63).png)
 (45).png)
 (67).png)
 (68).png)
 (69).png)
 (70).png)
 (71).png)
 (72).png)
 (73).png)
 (86).png)
 (87).png)
 (89).png)
 (92).png)