

Across July, August, and September, Atlanta’s short-term rental market averaged 21.2% more listings than the same quarter last year, while booked nights increased only 3.9%. Occupancy fell 1.5 percentage points to 54.3%, and RevPAR still rose 9.4% to $109.14 because ADR held 12.5% above last year.
The monthly results varied greatly within the quarter, with August producing the lowest monthly-specific occupancy in the nine-year series at 53.1%, and RevPAR finished 0.9% below its 2025 value. In September, booked nights grew 17.4% year over year, with listing growth at 17.7%, the first month of 2026 in which demand kept pace with supply. However, monthly listings fell for the third consecutive month, from 19,292 in June to 18,070 in September, so we are seeing supply fall off the market (finally) from the 12-month World Cup accumulation.
Our portfolio earned $138.92 per available unit-night across the quarter, against $104.05 for the comparable one- to four-bedroom market, a directional lead of 34%. The lead widened each month, from 24% in July to 32% in August and 47% in September, because our RevPAR recovered almost all of its August decline in September while the market’s barely moved. September finished 1.3% below July for our portfolio and 16.9% below July for the market.
Contents
The Market in Q3
| Atlanta market, all bedrooms | July 2026 | vs Jul 2025 | August 2026 | vs Aug 2025 | September 2026 | vs Sep 2025 |
|---|---|---|---|---|---|---|
| Total listings | 19,261 | +27.2% | 18,523 | +18.7% | 18,070 | +17.7% |
| Available nights | 377,266 | +11.4% | 353,066 | +6.2% | 345,950 | +3.0% |
| Booked nights | 210,537 | −2.2% | 187,600 | −0.3% | 186,357 | +17.4% |
| Occupancy | 55.8% | −7.8pt | 53.1% | −3.5pt | 53.9% | +6.6pt |
| ADR | $222.66 | +21.2% | $188.16 | +5.5% | $189.38 | +10.0% |
| RevPAR | $124.26 | +6.4% | $99.98 | −0.9% | $102.02 | +25.4% |
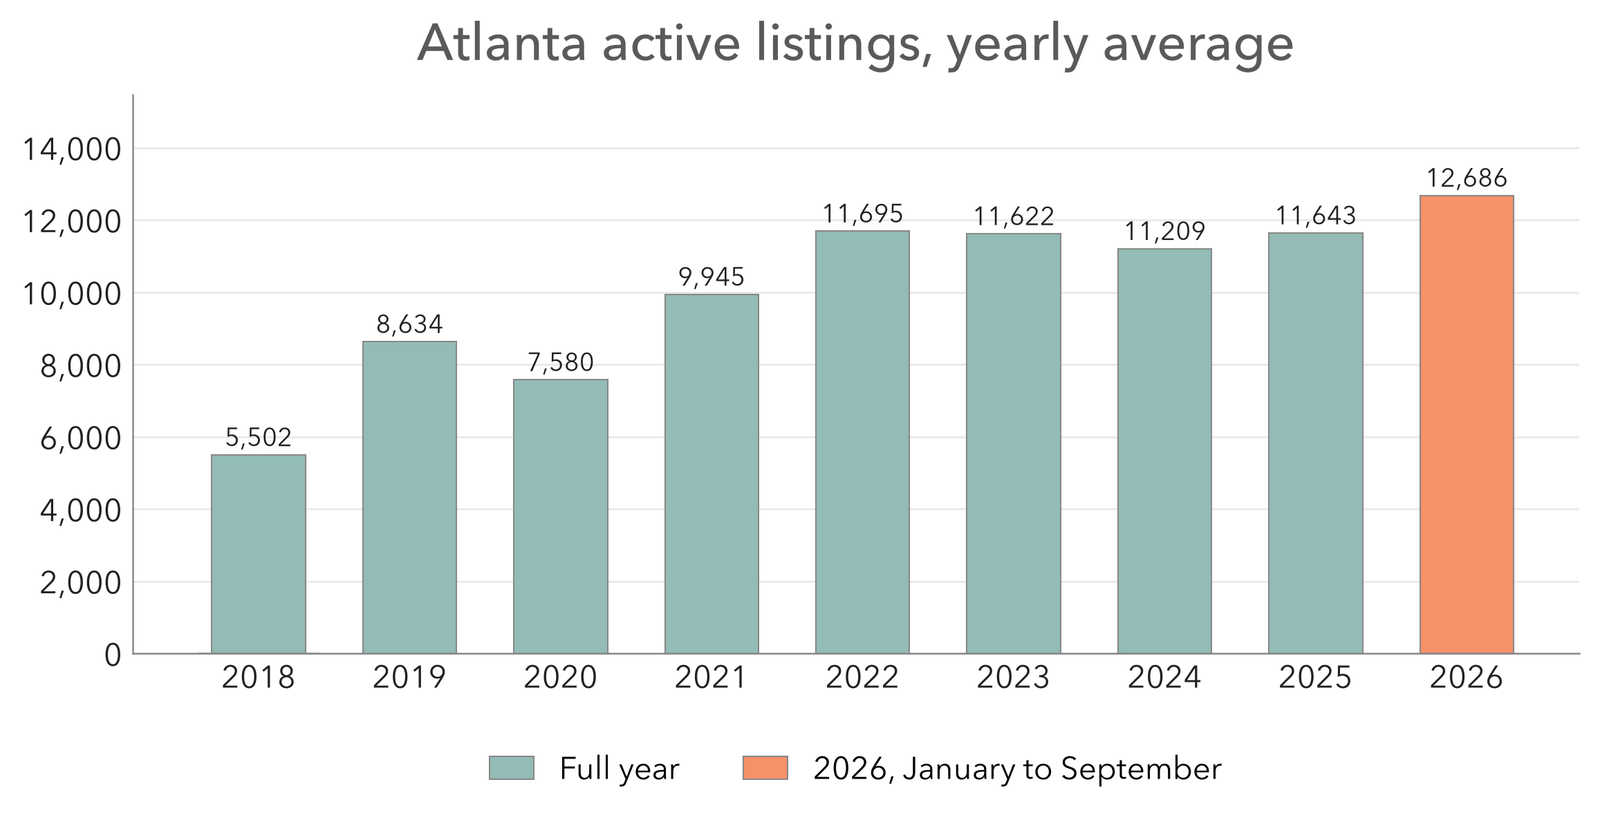
Figure 1. Atlanta active listings, yearly average; 2026 covers January to September. All bedroom configurations.
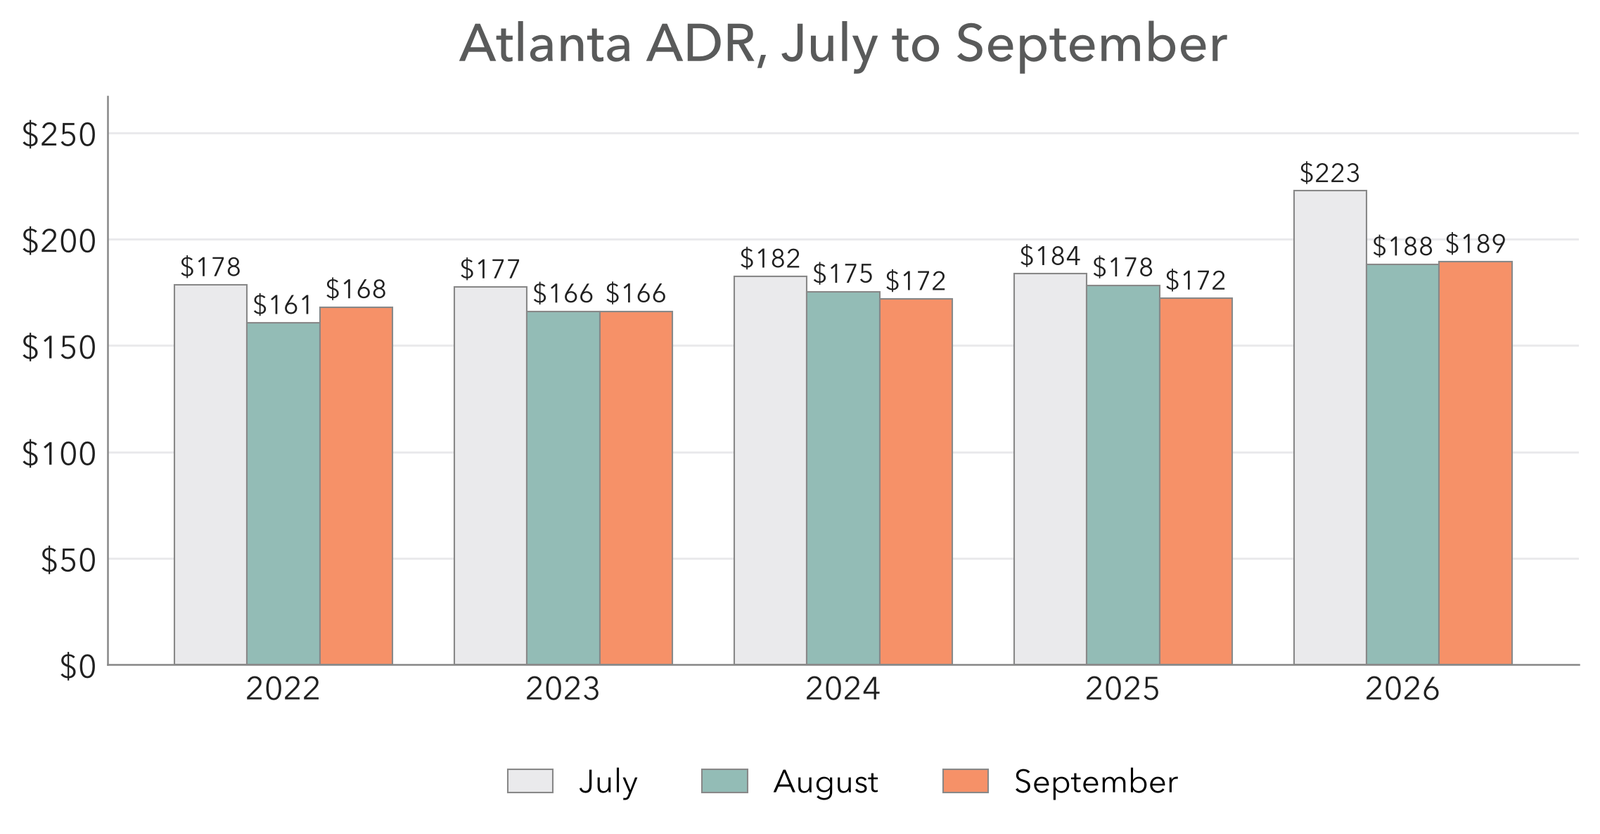
Figure 2. Atlanta market ADR, July to September of each year, 2022 to 2026. All bedroom configurations.
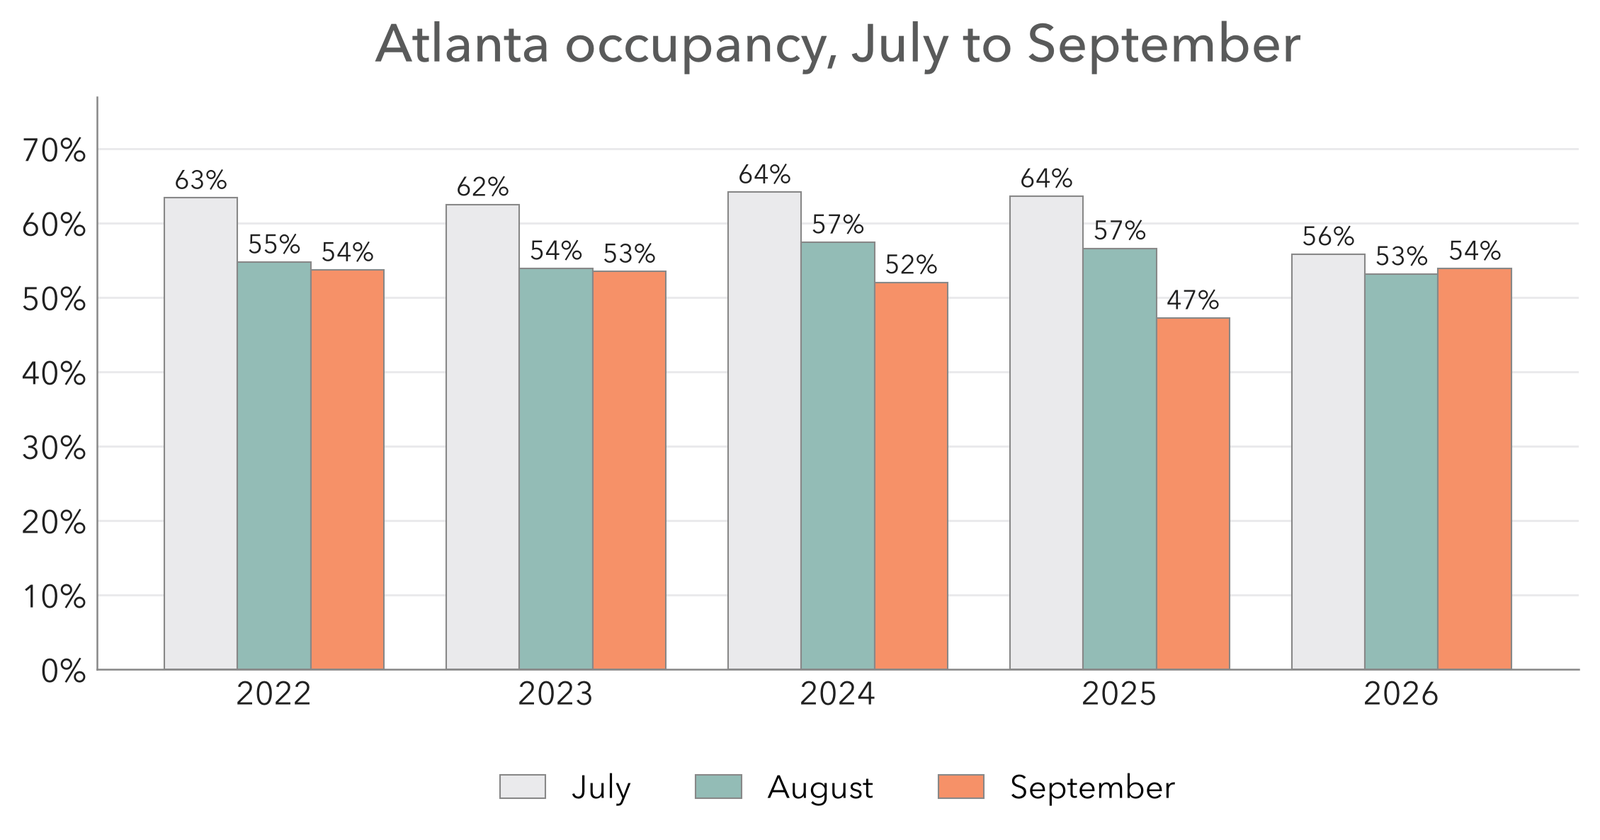
Figure 3. Atlanta market occupancy, July to September of each year, 2022 to 2026. All bedroom configurations.
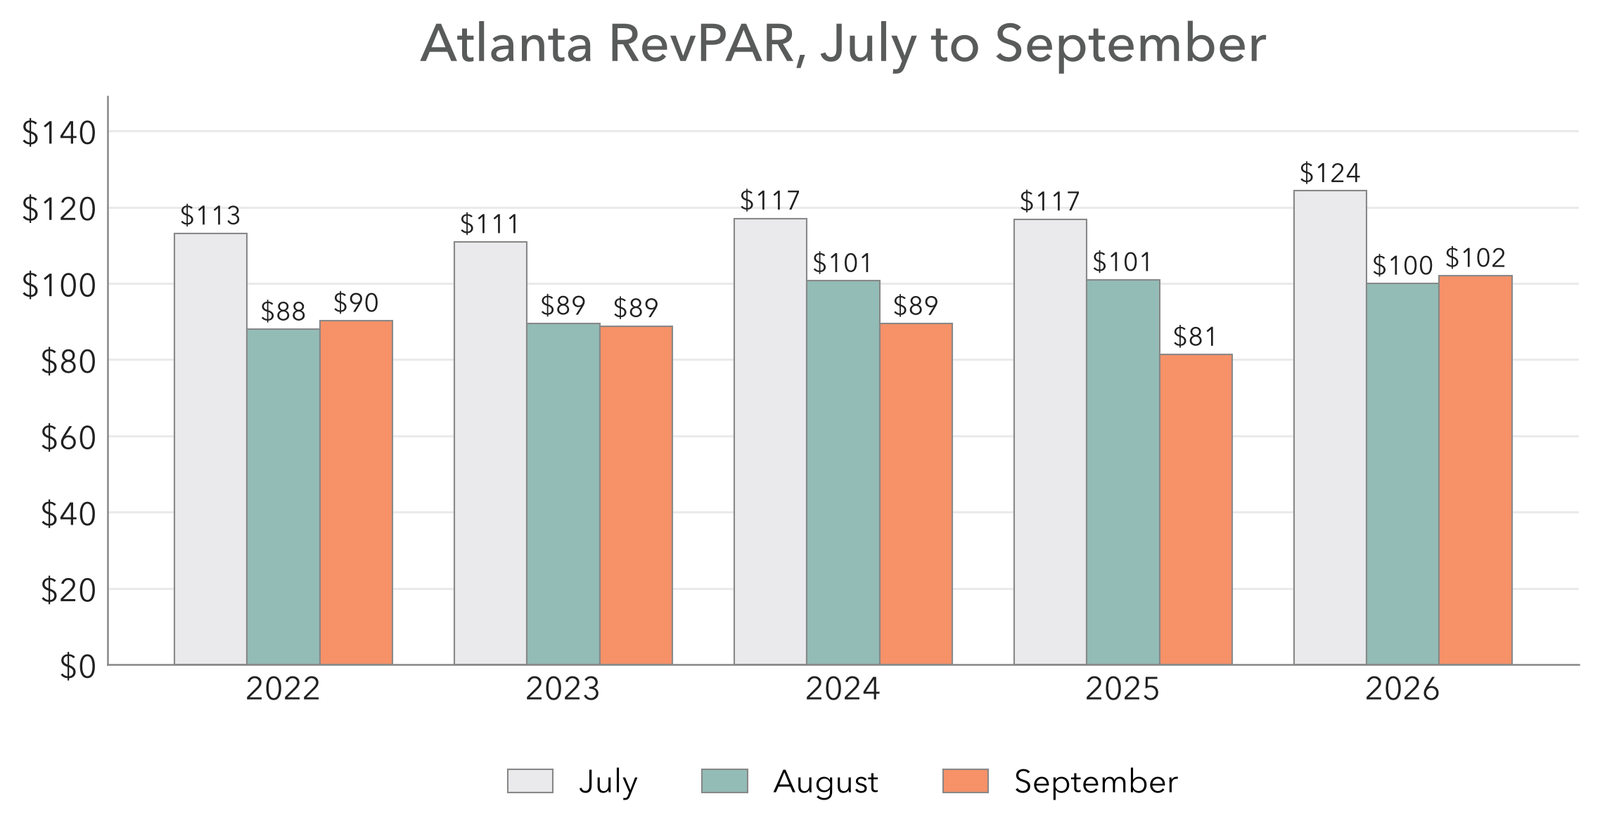
Figure 4. Atlanta market RevPAR, July to September of each year, 2022 to 2026. All bedroom configurations.
July continued June’s World Cup pattern discussed in our World Cup update, with ADR 21.2% above last year, occupancy 7.8 points lower, and a modest 6.4% RevPAR gain that came entirely from rate. August shows the underlying market more clearly. ADR fell to $188.16, 5.5% above August 2025, while listings remained 18.7% higher and booked nights were flat. RevPAR slipped 0.9% below last year, and the 53.1% occupancy was the weakest August AirDNA has recorded for Atlanta since 2017.
September looks much stronger on a year-over-year basis, which could be a more indicative measure of what’s really going on underneath all of the supply shifts due to the World Cup. RevPAR rose 25.4% and occupancy rose 6.6 points, but September 2025 was the weakest September in the series at 47.2% occupancy. Measured against earlier years, September 2026 occupancy of 53.9% sits in line with 2022 (53.7%), 2023 (53.5%), and 2024 (52.0%).
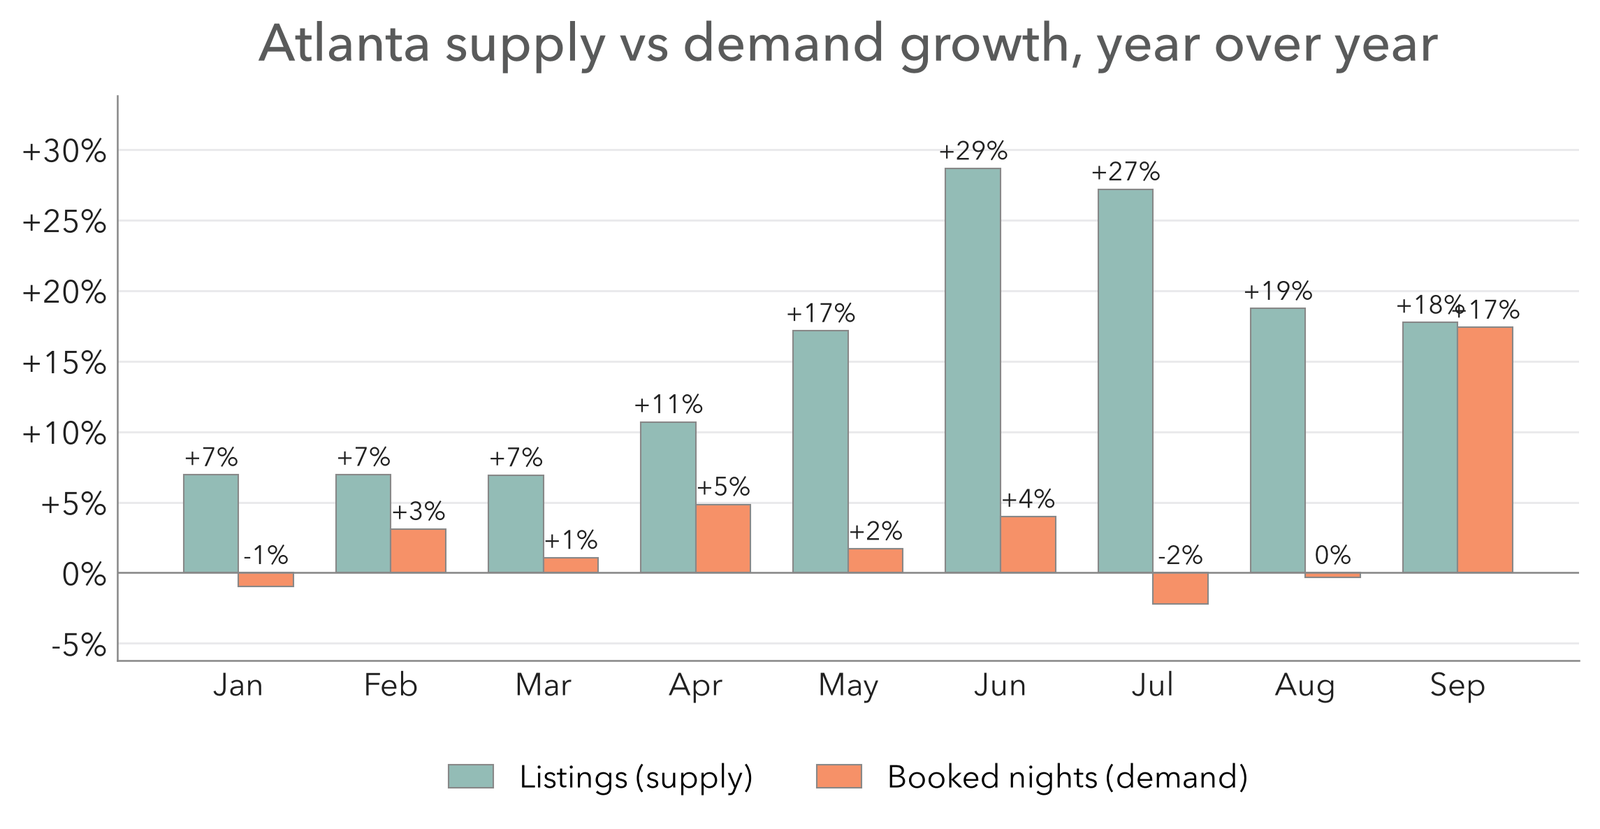
Figure 5. Atlanta listing growth versus booked-night growth, year over year, January to September 2026.
Figure 5 shows a more durable change, where listing growth is continuing to decline. September showed unusually high demand growth, but we are forecasting a strong fourth quarter this year (in both occupancy and ADR), relative to traditional low-season numbers.
Performance by Bedroom Configuration
The configuration data shows where the oversupply remains concentrated. The Q3 totals compared with Q3 2025 are below:
| Segment | Listings (Q3 avg) | Booked nights | Occupancy | ADR | RevPAR |
|---|---|---|---|---|---|
| 1-bed | +11.1% | +0.7% | −1.8pt | +11.4% | +7.9% |
| 2-bed | +14.7% | +4.4% | −0.3pt | +10.1% | +9.5% |
| 3-bed | +25.2% | +5.9% | −1.9pt | +8.9% | +5.2% |
| 4-bed | +25.7% | +4.4% | −2.9pt | +14.9% | +8.6% |
| 5-bed+ | +27.4% | +19.4% | +1.3pt | +15.1% | +18.3% |
Three- and four-bedroom homes still carry the largest supply increase, with roughly a quarter more listings than last year and booked-night growth of only 4 to 6%. Three-bedroom homes produced the smallest RevPAR gain of any segment at 5.2%, because rate growth of 8.9% was not enough to offset the additional competition. Two-bedroom homes were the most balanced segment, with occupancy essentially unchanged and RevPAR up 9.5%.
September tells a more encouraging story for the smaller configurations. One-bedroom booked nights grew 12.9% against 9.6% listing growth, and two-bedroom booked nights grew 21.7% against 12.1% listing growth. Three- and four-bedroom homes were the exceptions, with listings still growing faster than booked nights in September (21.7% against 19.9% for three bedrooms, 18.6% against 13.9% for four bedrooms). Five-bedroom-plus homes again outperformed, showing both the highest supply growth and the highest demand growth, with an impressive RevPAR growth of nearly 20% for the cohort across the quarter.
Minty’s Q3
We calculate portfolio RevPAR as revenue earned per available unit-night, counting every managed unit whether that night booked or not, and we add back the host fee and the cleaning fee so the revenue basis matches AirDNA’s. AirDNA divides by the nights owners chose to list rather than every unit-night, so the market-relative levels below are directional rather than a reconciled like-for-like comparison.
| Configuration | July | August | September | September vs July |
|---|---|---|---|---|
| 1-bedroom | $91.65 | $77.37 | $95.10 | +3.8% |
| 2-bedroom | $141.50 | $116.57 | $140.49 | −0.7% |
| 3-bedroom | $199.49 | $176.14 | $196.02 | −1.7% |
| 4-bedroom | $255.71 | $229.25 | $253.16 | −1.0% |
| Portfolio | $146.53 | $125.28 | $144.65 | −1.3% |
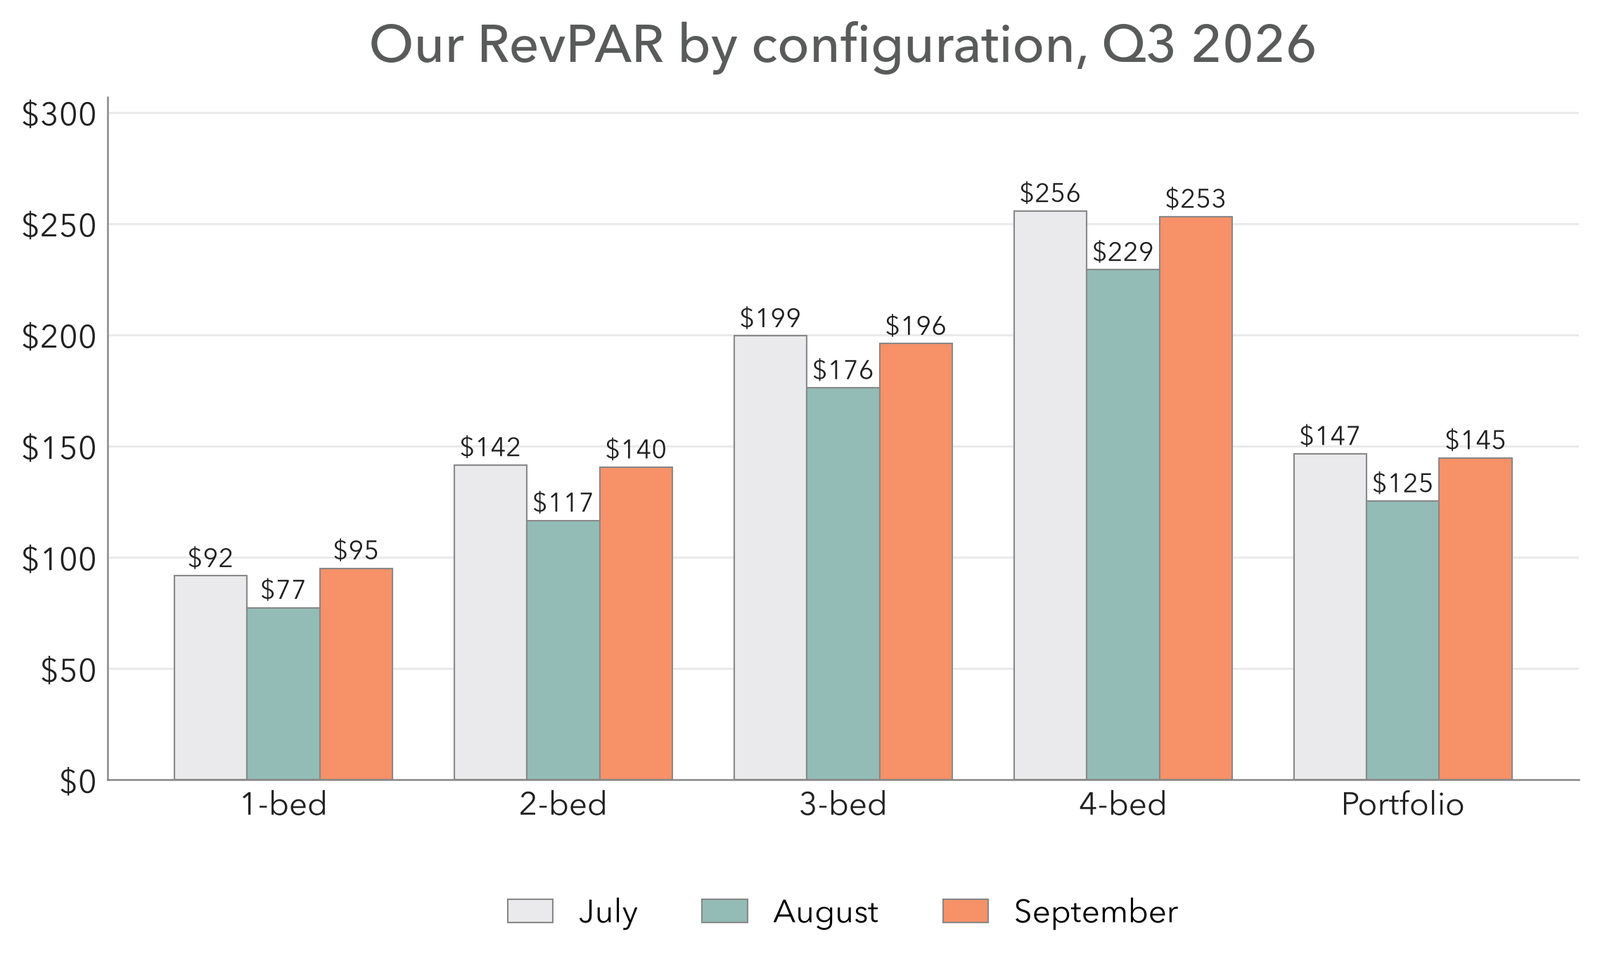
Figure 6. Our RevPAR by bedroom configuration, July to September 2026.
Portfolio RevPAR fell 14.5% from July to August, then recovered 15.5% in September to finish within 1.3% of July. The comparable market fell 19.8% in August and recovered only 3.5% in September. Two-, three-, and four-bedroom homes finished September within 2% of their July levels, and one-bedroom homes finished 3.8% above July. One-bedroom was the configuration that weakened most against its own baseline in the last update, so that recovery changes the case for treating it differently from the rest of the portfolio.
The August decline was not uniform. One- and two-bedroom homes fell 15.6% and 17.6%, slightly more than their market segments (14.6% and 16.3%). Three- and four-bedroom homes fell 11.7% and 10.3%, roughly half the market’s 22.4% and 25.9% declines in those segments. The larger homes therefore held up best in August, while the smaller homes recovered fastest in September.
Comparison with the Atlanta Market
| Configuration | July | August | September |
|---|---|---|---|
| 1-bedroom | +11% | +10% | +25% |
| 2-bedroom | +27% | +25% | +46% |
| 3-bedroom | +46% | +66% | +81% |
| 4-bedroom | +32% | +60% | +74% |
| Portfolio | +24% | +32% | +47% |
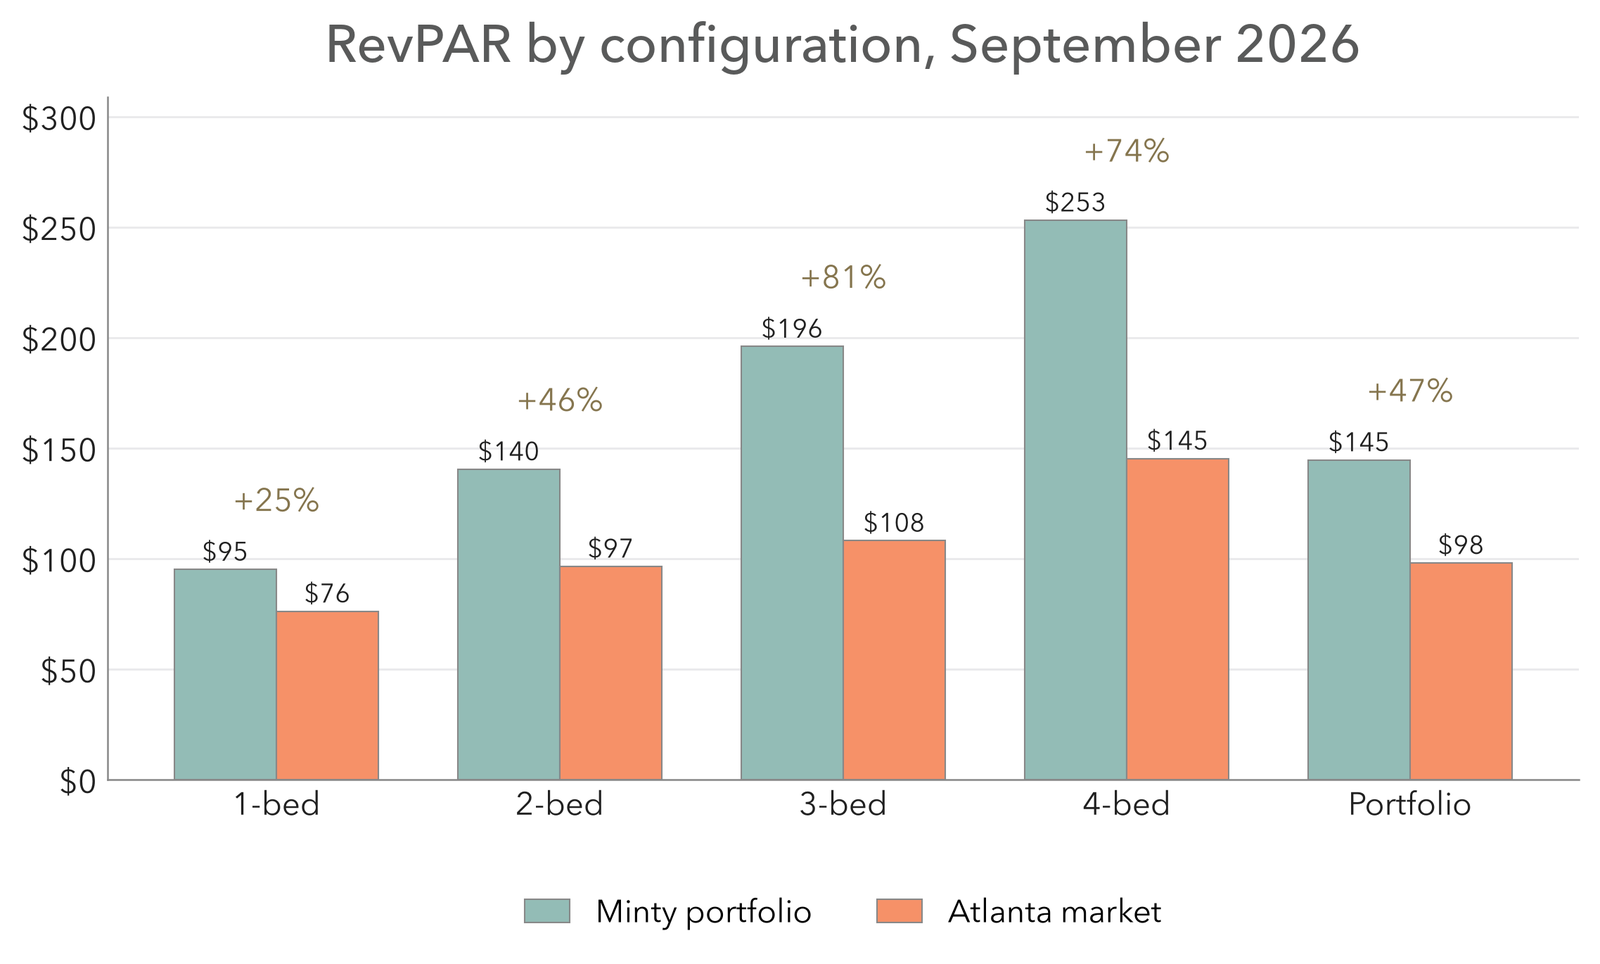
Figure 7. RevPAR by bedroom configuration, our portfolio against the Atlanta market, September 2026.
Displayed Minty RevPAR exceeded the market series in every configuration in every month of the quarter, and the directional portfolio gap widened from 24% in July to 32% in August and 47% in September. Most of that widening came from the market side, because one- to four-bedroom market RevPAR finished September 16.9% below July while ours finished 1.3% below. The three- and four-bedroom gaps are the largest because those are the segments where market RevPAR fell furthest, by 20.9% and 24.8% from July to September. Those are also the segments that still carry roughly a quarter more listings than last year, which is consistent with, though not proof of, supply pressure driving the decline. Because the availability denominators differ, the level of each gap is directional; the direction, a lead that grew as the market weakened, holds on both series’ own bases.
Rate and Occupancy
| Occupancy | July | August | September |
|---|---|---|---|
| Minty portfolio | 74.9% | 72.4% | 77.0% |
| Atlanta market, 1-4 bed | 56.0% | 53.4% | 54.2% |
| Lead | +18.9pt | +19.0pt | +22.8pt |
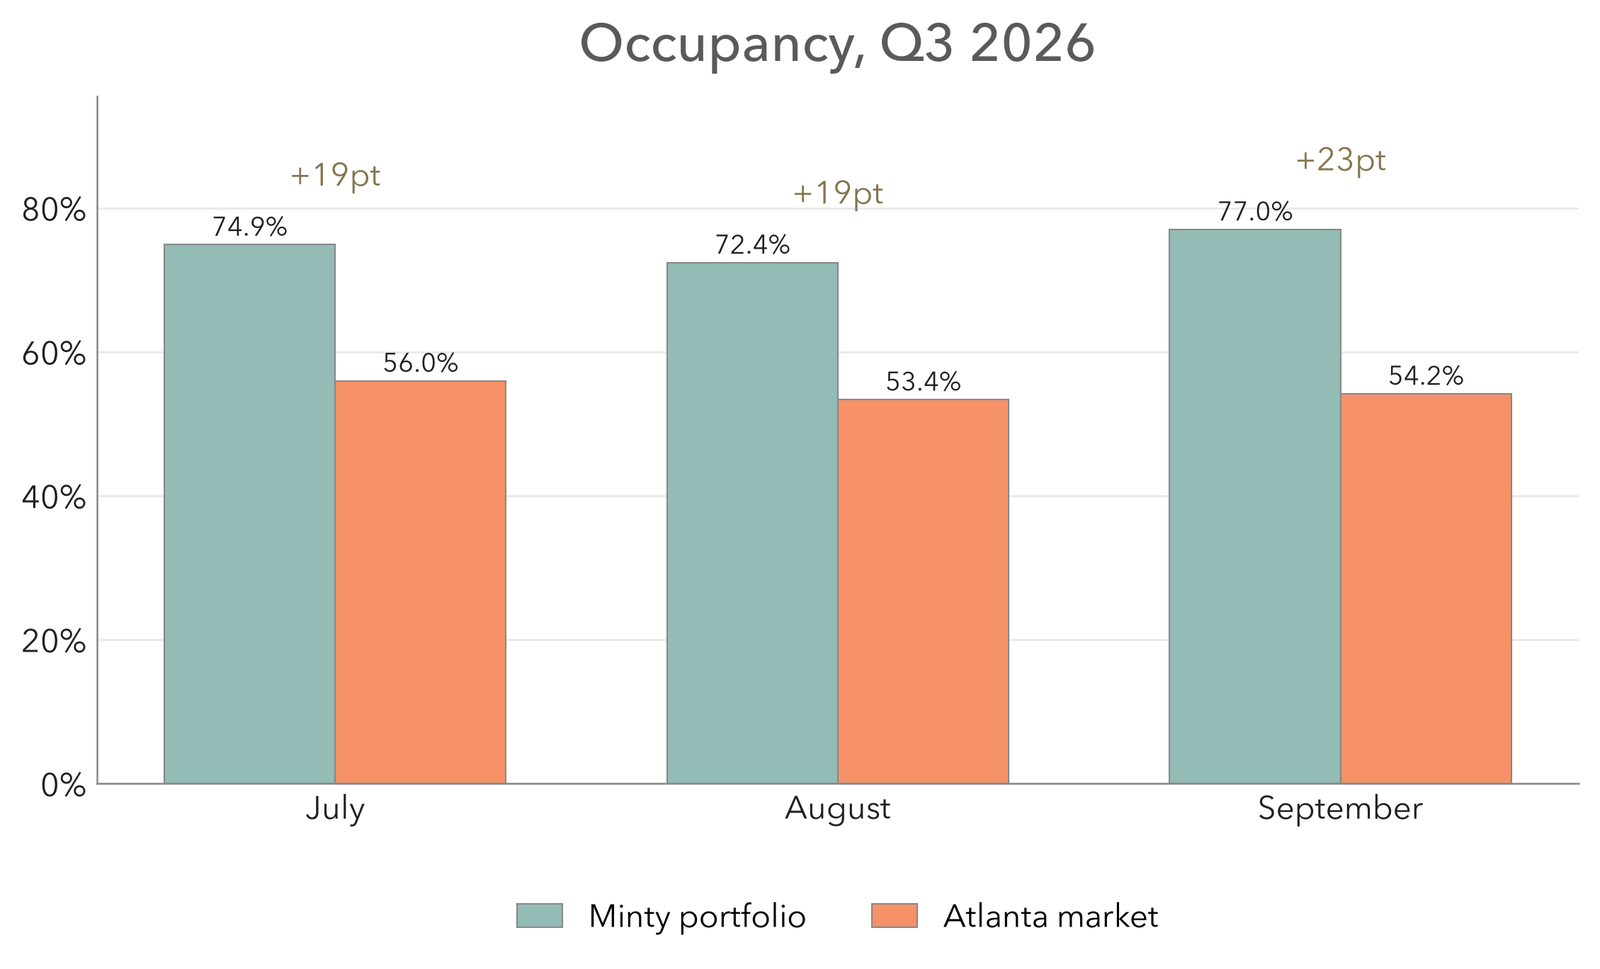
Figure 8. Occupancy, our portfolio against the Atlanta market, Q3 2026.
Our occupancy fell 2.5 points from July to August, against a 2.6-point decline for the market, so August affected both series by roughly the same amount. The two series diverged in September, when our occupancy rose 4.6 points to 77.0% while the market rose 0.8 points, widening the lead to 22.8 points. Our occupancy divides by every unit-night and AirDNA’s divides only by listed nights, so the gap is directional and, if anything, understates our position.
| ADR, comparable stays | July | August | September |
|---|---|---|---|
| Minty portfolio | $240.73 | $215.73 | $281.21 |
| Atlanta market, 1-4 bed | $211.02 | $177.61 | $181.06 |
| Lead | +14% | +21% | +55% |
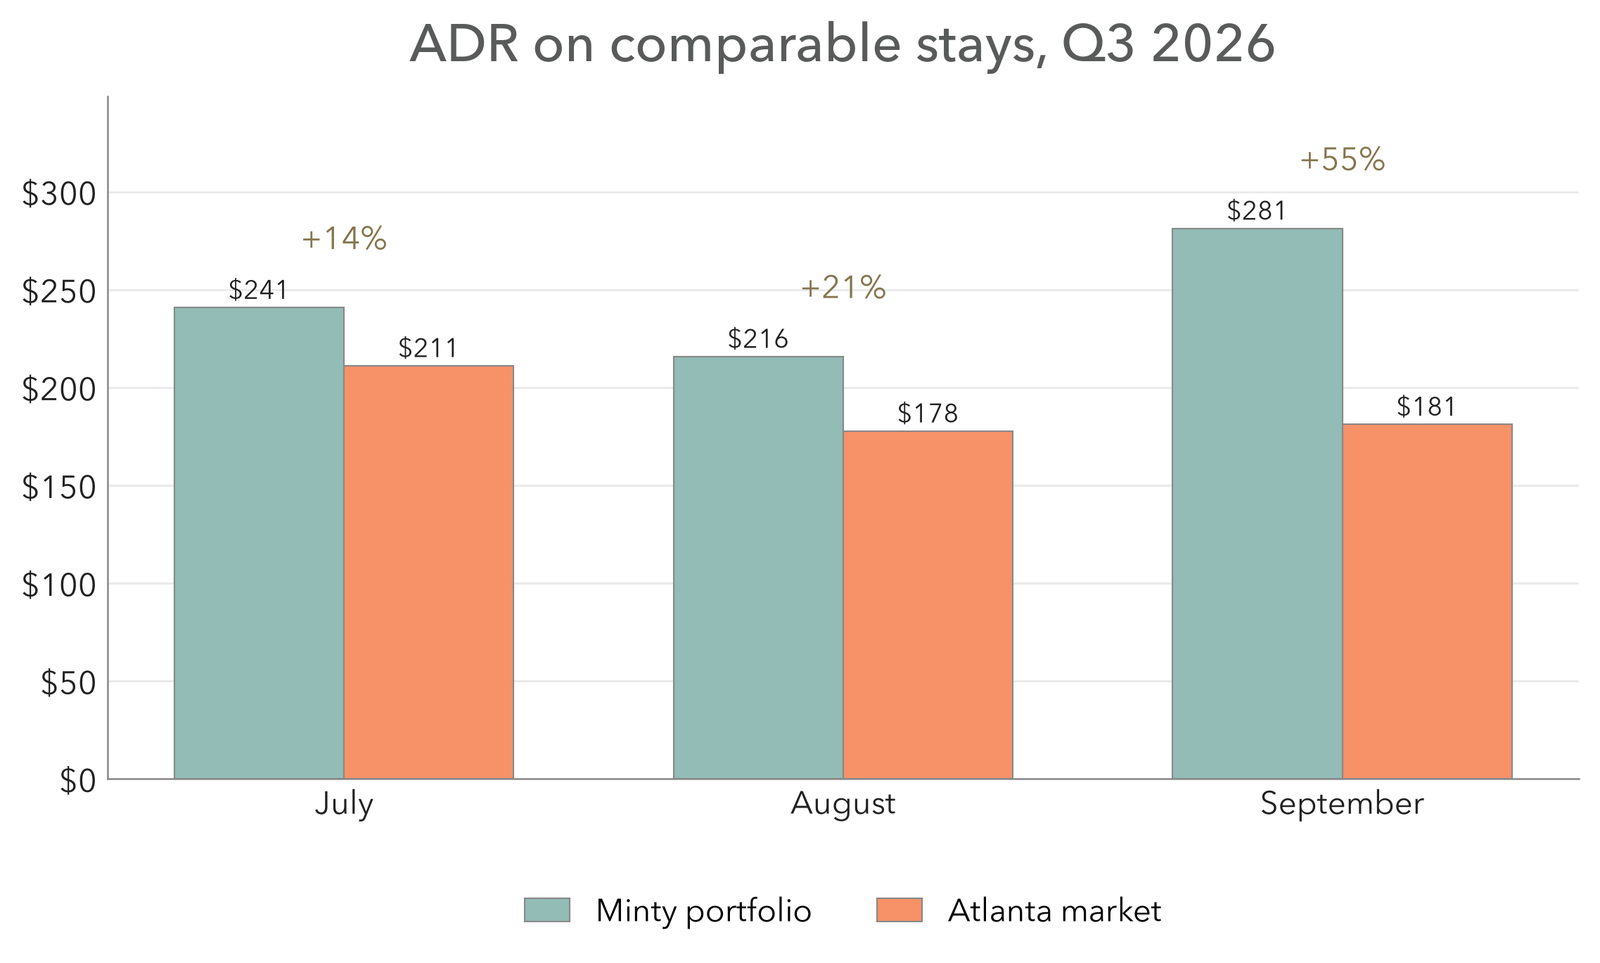
Figure 9. Average daily rate on comparable stays (under seven nights), our portfolio against the Atlanta market.
September’s recovery came from both components. Occupancy rose and the ADR on our comparable short stays rose to $281.21, 55% above the market’s $181.06, while market ADR stayed close to its August level. That ADR comparison covers only stays under seven nights, which were 176 of our 343 September stays and 578 of 3,397 booked nights, so it describes the short-stay part of the book rather than the whole portfolio.
The Supply Outlook
Atlanta listings peaked at 19,292 in June and declined to 18,523 in August and 18,070 in September, a reduction of 1,222 listings, or 6.3%, in three months. In the last update we expected most of the incremental inventory to remain through the autumn. The early contraction is faster than we assumed, and we are updating the forecast to reflect it.
Supply is still well above last year. September listings remained 17.7% higher than September 2025, and three- and four-bedroom inventory remains roughly a quarter larger. Our current expectation is that the remaining excess will continue to work down through the winter as owners who entered the market in the past year sell, return to long-term leasing, or stop renewing listings, but we cannot observe those decisions directly and the pace is uncertain. January and February are typically Atlanta’s weakest occupancy months, so the next two quarters will still test owners who are competing against more homes than a year ago.
Demand Outlook
Our forward bookings are well ahead of where they normally sit going into the low season. At the start of each month we look at how much of that month is already booked, on the same basis as our owner statements, and compare it with the same point in 2024 and 2025. We started July 7.5 points behind that average, then moved ahead and widened the gap each month: 8.7 points ahead at the start of August, 12.3 in September, and 13.4 in October. On October 1, 66.0% of October’s unit-nights were already booked, against an average of 52.6%.
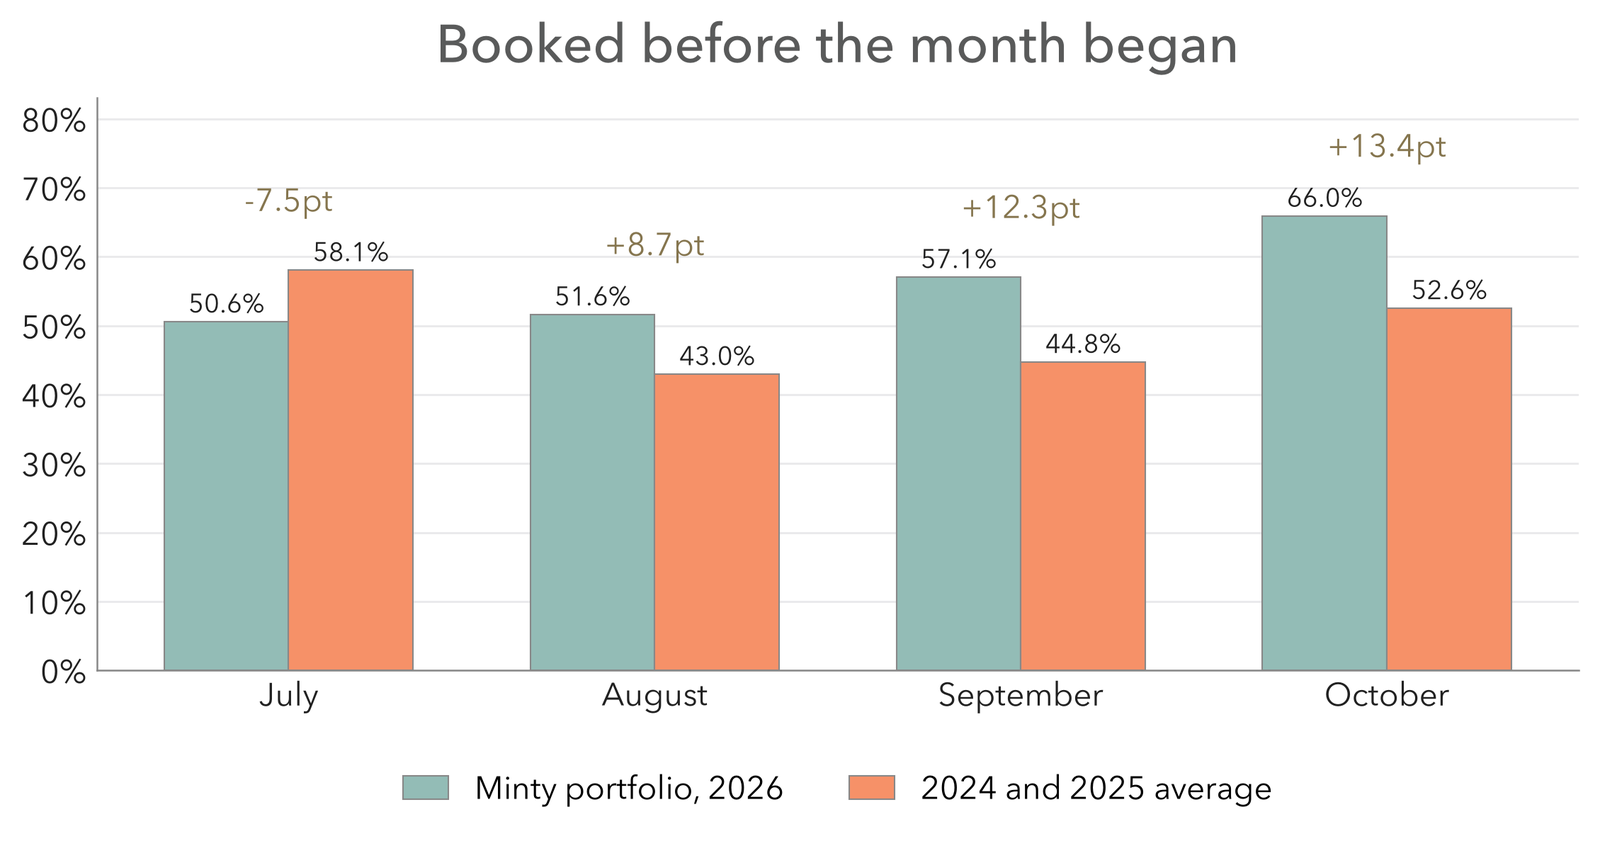
Figure 10. Share of each month’s unit-nights already booked on the first of the month, owner-statement basis, 2026 against the 2024 and 2025 average.
November and December are further ahead still. As of October 23, 64.2% of November and 47.1% of December are already booked, against 42.9% and 24.9% at the same date in 2024 and 2025. The market around our homes is well behind us: PriceLabs data for the comparable listings nearest each of our homes shows November 33.1% booked and December 16.0%, up from 27.3% and 11.4% at this point last year. PriceLabs measures against the nights those listings left open, so, like the other market comparisons in this report, the gap is directional. Most of our nights come from longer stays booked directly with us: stays of 30 nights or more make up 90% of the nights on the books for November and December, and direct bookings make up 86%. That is the longer-stay approach we described in the last update, and it gives the portfolio a floor for the low season.
The rate on those bookings is strong as well. Short stays already booked for November average $469 a night on the same basis as our owner statements, against $304 at this point last year and a market that averaged $167 across all of November 2025. Thanksgiving week accounts for about half of those nights, and early bookings usually run above where the month finishes (last November finished at $284), so the final figure will come down. Even outside Thanksgiving week, the November short stays on the books average $418 a night.
Our work to generate direct-booking leads has also paid off, with lead volume up 65% in Q3 over Q3 2025. That has positioned the portfolio for a strong Q4 as we head into the low season.
Outlook
| Signal | Our current interpretation |
|---|---|
| Listings down 6.3% from the June peak, still +17.7% YoY | Supply has begun to contract earlier than we forecast, but the excess over last year remains large. |
| September booked nights +17.4% against listings +17.7% | The first month of 2026 in which demand kept pace with supply; one month is not yet a trend. |
| August occupancy 53.1%, the lowest August in the series | The summer’s rate gains did not carry into August. |
| September RevPAR +25.4% YoY against the weakest prior September on record | The comparison base flatters the gain; September occupancy is in line with 2022 to 2024. |
| Our RevPAR September vs July −1.3%; market −16.9% | Our portfolio recovered its August decline; the market did not. |
| Displayed portfolio gap widened: +24% → +32% → +47% | The directional gap widened as the market weakened; the level comparison is not reconciled like for like. |
Atlanta enters Q4 with fewer listings than at the June peak but still about 18% more than a year ago, and with September demand finally growing as fast as supply. Our portfolio enters the same period having finished September within 1.3% of its July RevPAR while the comparable market finished 16.9% lower. The first observation rests on one month of market data; the second is a within-series comparison that does not depend on reconciling the two availability bases. Together they argue for continuing to protect occupancy through January and February while watching whether the September supply-demand balance holds into the autumn.